Skills entdecken

Originale Workflows für Websites, Bilder, Präsentationen und bewegte Inhalte.

8 Skillsfür “data-visualization”
Filter zurücksetzen
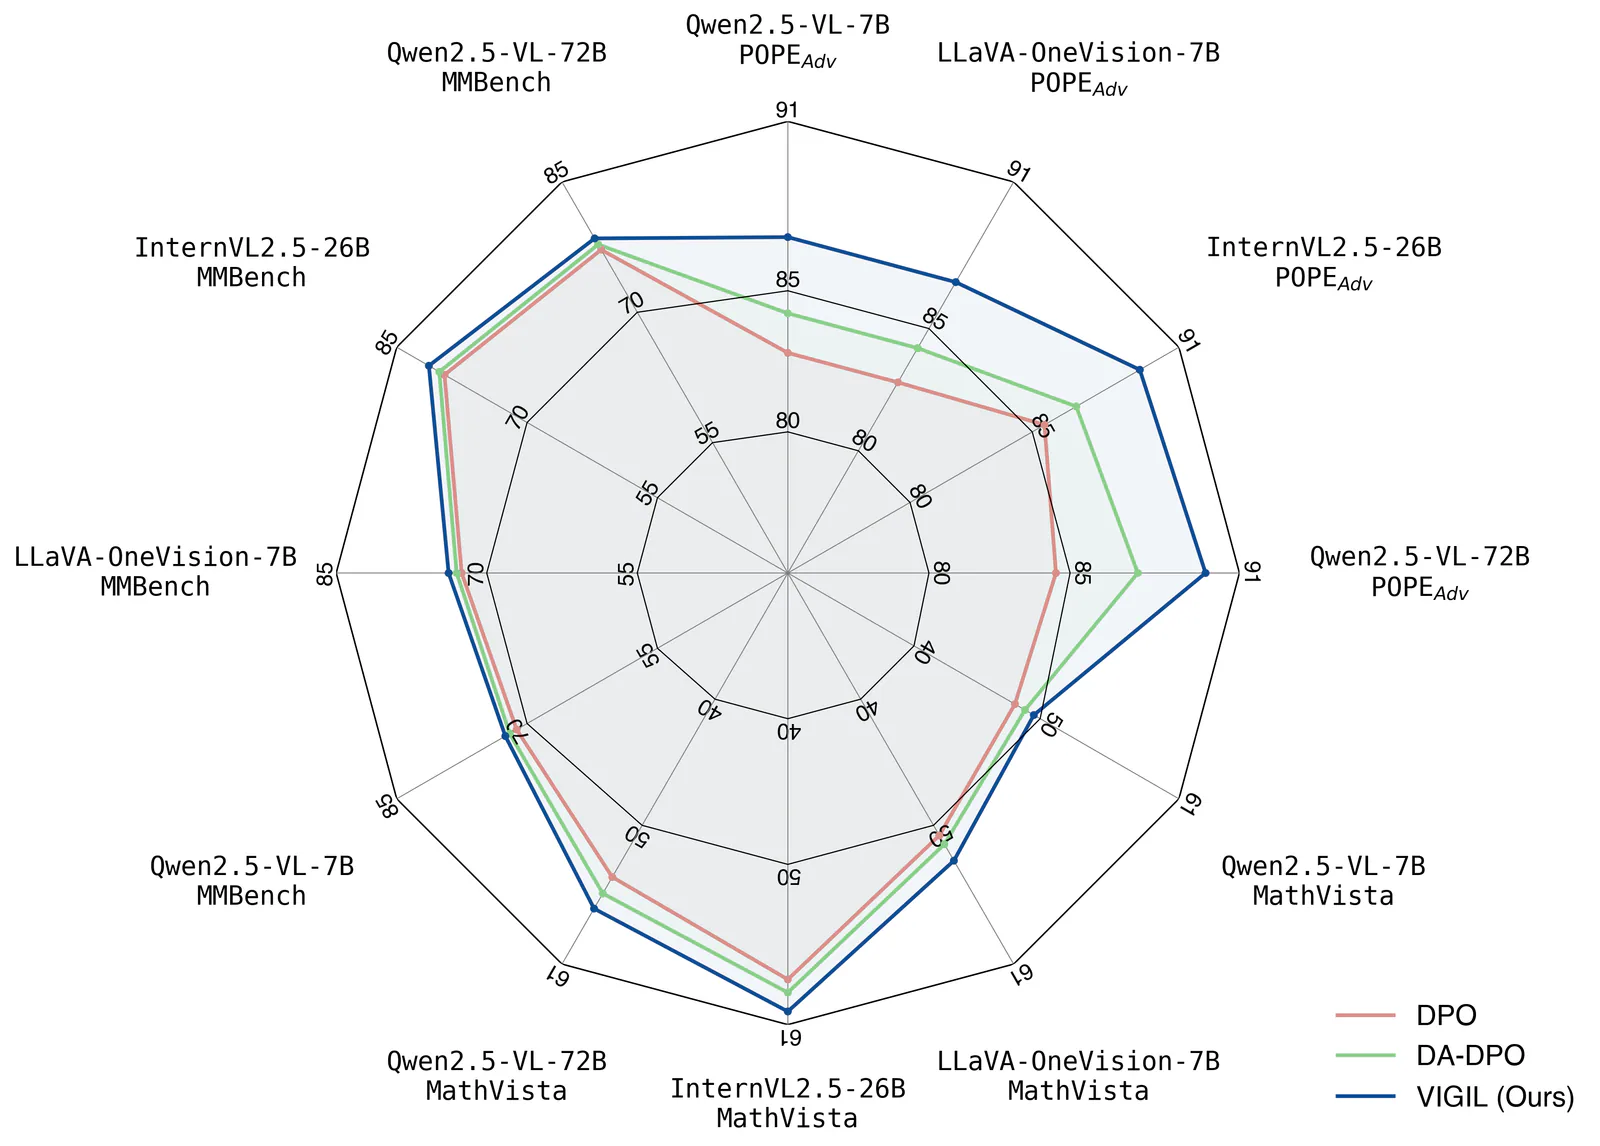
Chen Liu's VIGIL radar comparison, reused from the figures4papers README.
Kostenlos
Bilder

Figures for Papers

Create publication-style Matplotlib charts with an AI agent, using scientific plotting conventions, reference scripts and print or vector export guidance.

11.112Sterne767Forks
Letzter Repository-Push

Audit and fix visual hierarchy, spacing, color, and depth in web UIs. Use when the user mentions "my UI looks off" (or amateur/unprofessional), "fix the design", "Tailwind styling", "color palette", "visual hierarchy", "design system", "spacing scale", or "component styling". Also trigger when building consistent design tokens, creating dark mode themes, improving data-visualization clarity, or polishing UI details before launch. Covers grayscale-first workflow, constrained design scales, shadows, and component styling. For typeface selection, see web-typography. For usability audits, see ux-heuristics.
  • ui design
  • frontend
2702Sterne266Forks
Letzter Repository-Push

Dashboard Creator

mhattingpete

Create an HTML dashboard with KPI cards, charts and progress indicators.

  • dashboards
  • data-visualization
694Sterne98Forks
Letzter Repository-Push
SeeCode Diagrams — Bar chart export
Kostenlos
Bilder

SeeCode Diagrams

Create animated and explorable diagrams from compact JSON specifications, with scripted layout, styling, motion, and export workflows.

934Sterne68Forks
Letzter Repository-Push
Nature Skills repository banner with a research robot and its literature, writing, review and figure workflows.
Kostenlos
Bilder

Nature Figure

Create scientific figures in Python or R, with multi-panel layout checks, editable outputs and optional AI schematic drafts.

53.294Sterne2771Forks
Letzter Repository-Push
Kostenlos
Web und UI

AntV L7

Build WebGL map applications with interactive geographic layers, animations, and spatial datasets.

4078Sterne653Forks
Letzter Repository-Push
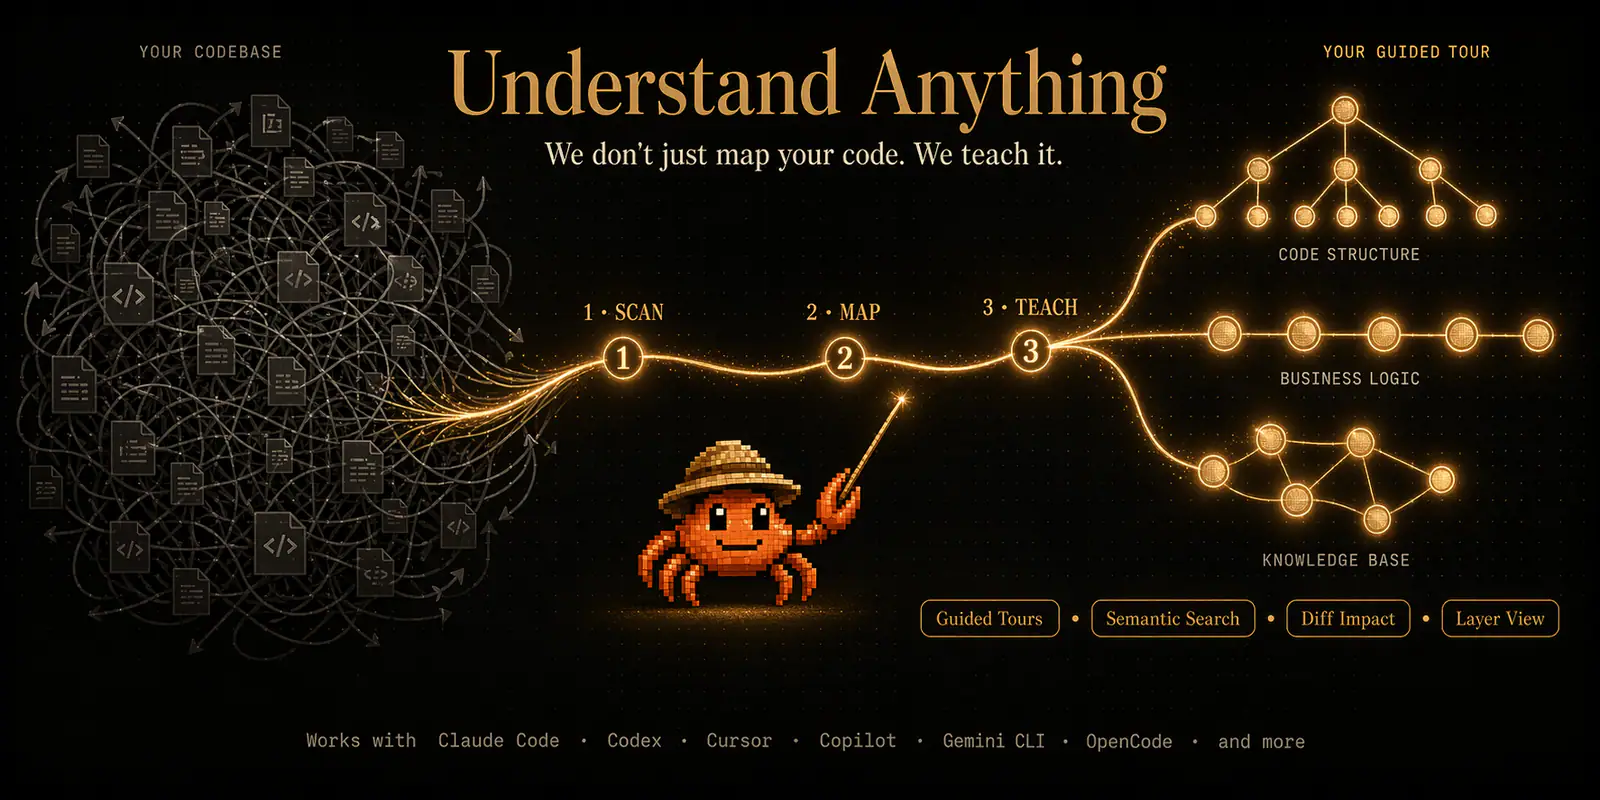
Understand Anything codebase graph
Kostenlos
Recherche und Daten

Understand Anything: Graph Dashboard

Launch an interactive dashboard for exploring a project’s saved knowledge graph.

92.265Sterne7868Forks
Letzter Repository-Push
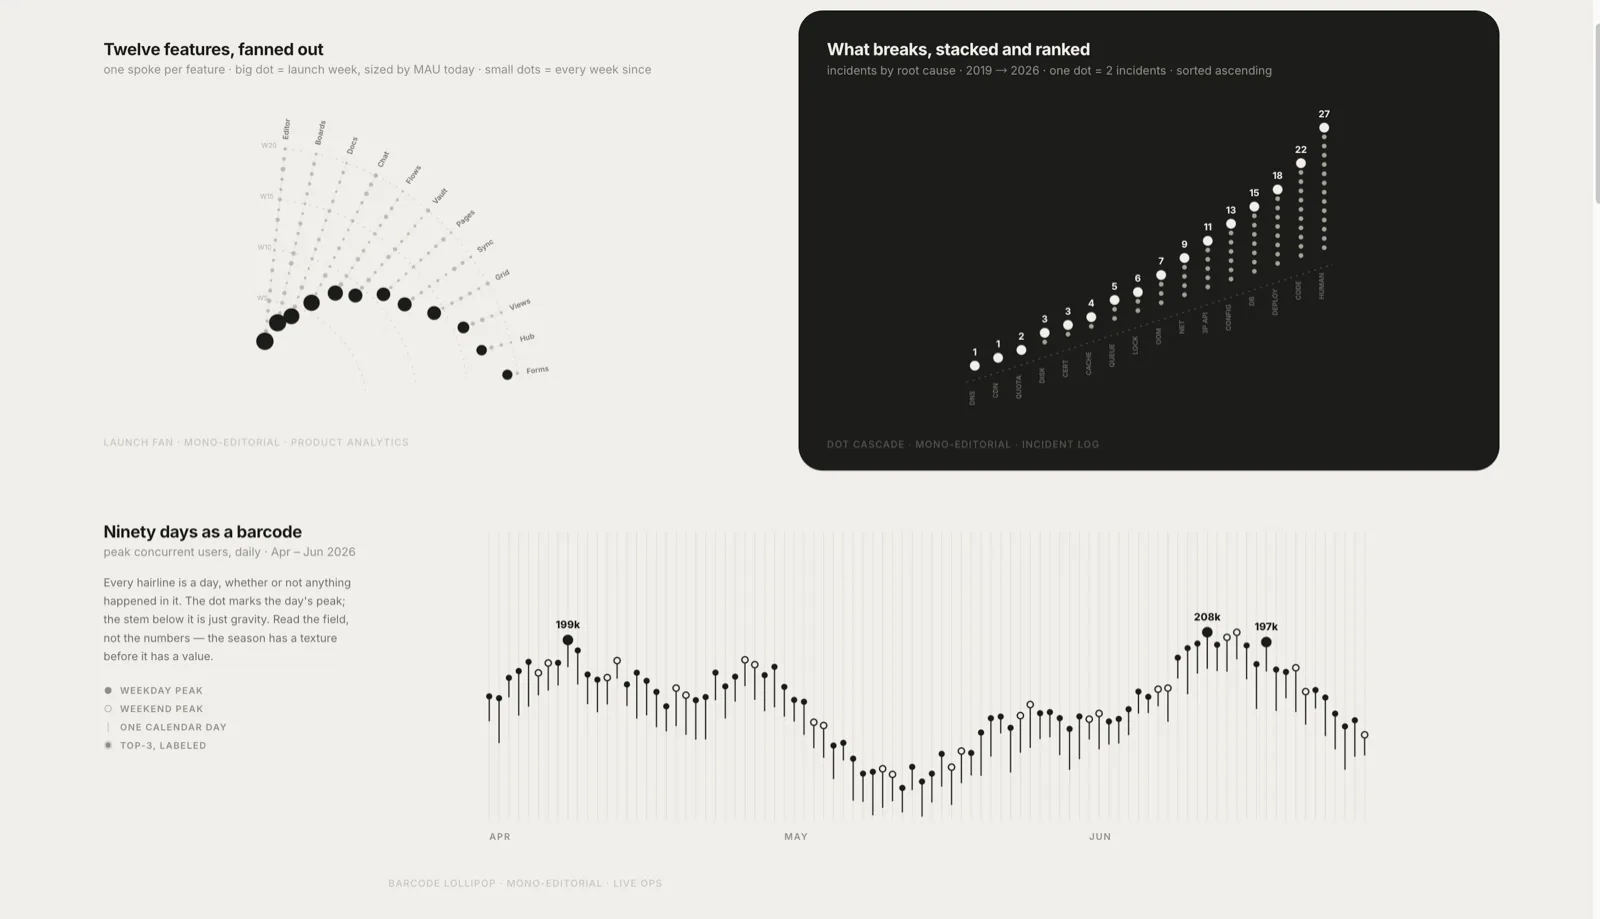
Lieflat Charts — official illustration from the upstream README
Kostenlos
Dokumente

Lieflat Charts

Create template-driven HTML data visualizations, full-page reports, and HTML or PDF presentations with consistent typography and chart styles.

6830Sterne414Forks
Letzter Repository-Push

Eine kleine, sorgfältig gestaltete Bibliothek. Weitere Skills folgen.