Use this skill whenever the user wants to create, customize, or troubleshoot G2 v5 chart visualizations. Triggers include: any mention of 'G2', 'antv g2', '@antv/g2', 'G2 chart', 'G2 可视化', or requests to produce charts like bar charts (柱状图), line charts (折线图), pie charts (饼图), scatter plots (散点图), area charts (面积图), heatmap (热力图), radar charts (雷达图), treemap (矩形树图), funnel charts (漏斗图), sankey diagrams (桑基图), gauge (仪表盘), wordcloud (词云), boxplot (箱线图), as well as G2-specific topics like encode channels, scale config, coordinate systems, transforms, interactions, themes, labels, and animations. Also use when debugging G2 rendering errors, V4→V5 migration issues, or chart type selection. Do NOT use for G6 graph/network visualization, X6 editor diagrams, or S2 pivot tables.
Skills entdecken
Originale Workflows für Websites, Bilder, Präsentationen und bewegte Inhalte.
Figures for Papers
Create publication-style Matplotlib charts with an AI agent, using scientific plotting conventions, reference scripts and print or vector export guidance.
ManimGX
Create mathematical explanations and 3D animations in Python, inspect their layout and timing, and export MP4 videos with editable scene source.
Audit and fix visual hierarchy, spacing, color, and depth in web UIs. Use when the user mentions "my UI looks off" (or amateur/unprofessional), "fix the design", "Tailwind styling", "color palette", "visual hierarchy", "design system", "spacing scale", or "component styling". Also trigger when building consistent design tokens, creating dark mode themes, improving data-visualization clarity, or polishing UI details before launch. Covers grayscale-first workflow, constrained design scales, shadows, and component styling. For typeface selection, see web-typography. For usability audits, see ux-heuristics.
data-ai skill for Claude AI. Grade A. Python graphing library for creating interactive, publication-quality visualizations with 40+ chart types.
Create an HTML dashboard with KPI cards, charts and progress indicators.
HTML Slides
Create strategic HTML presentation slides using layouts, design tokens and Chart.js visualizations.
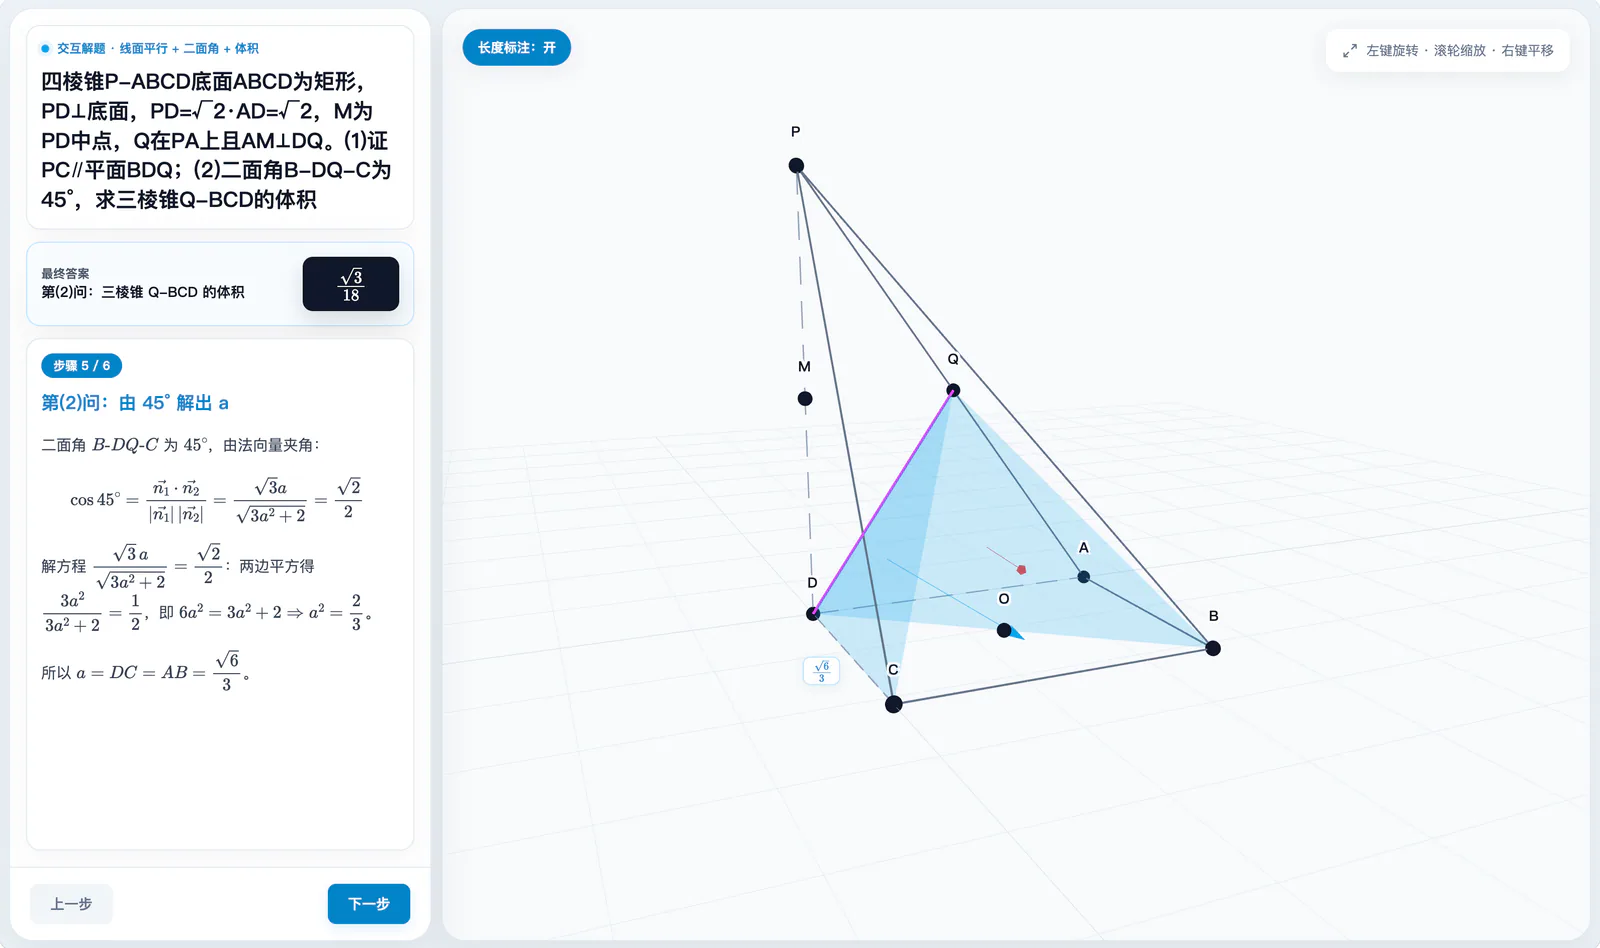
Interactive 3D Chemistry Reactions
Turn a reaction into a 3D molecular demonstration with balanced equations, bond changes, atom-conservation checks, and a reaction-progress slider.
SeeCode Diagrams
Create animated and explorable diagrams from compact JSON specifications, with scripted layout, styling, motion, and export workflows.
Visual Explainer
Turn systems, code changes and plans into visual HTML pages, diagrams and slide decks.

Nature Figure
Create scientific figures in Python or R, with multi-panel layout checks, editable outputs and optional AI schematic drafts.
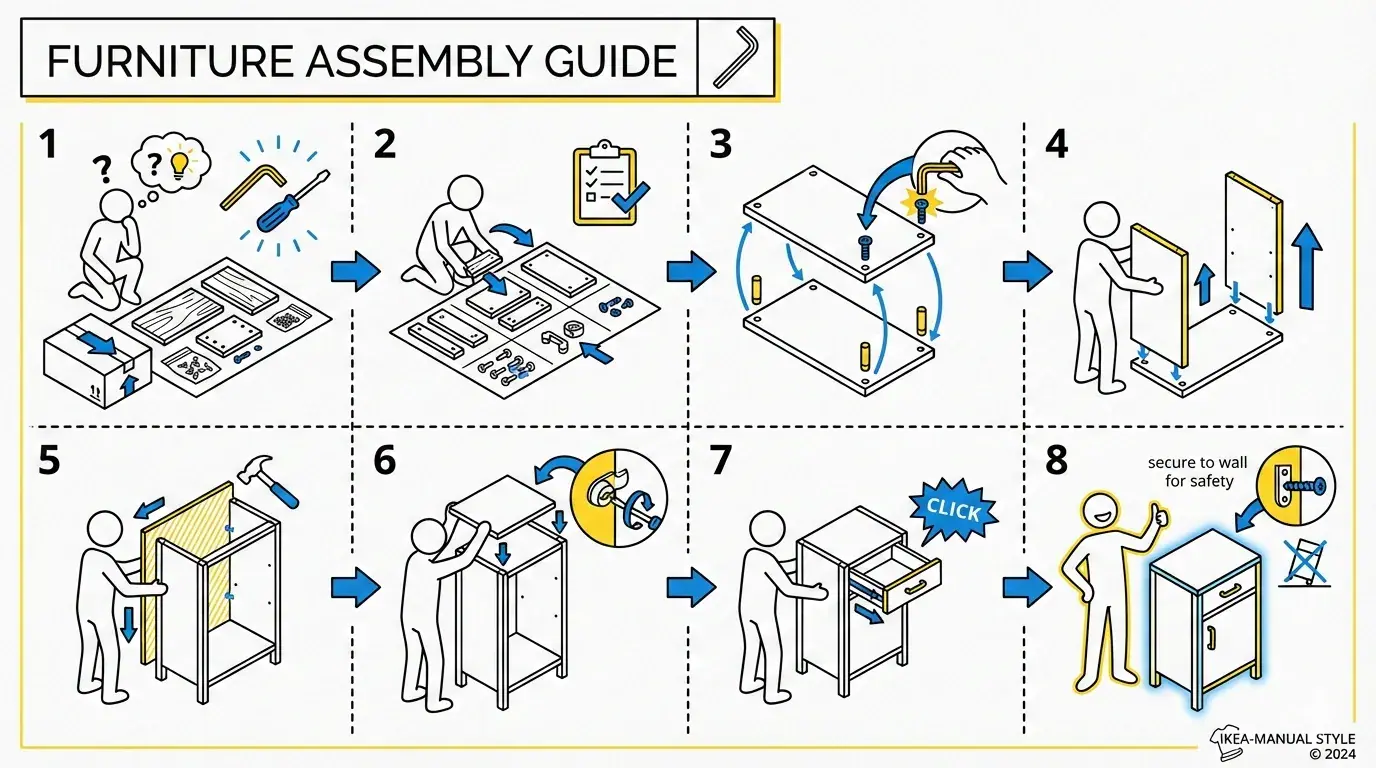
Infographic Creator
Transform source material into an infographic using selectable layouts and visual styles.
AntV L7
Build WebGL map applications with interactive geographic layers, animations, and spatial datasets.
Choose an honest visualization from a user story, metric, comparison, projection, target, or explanatory goal before selecting TanStack Charts marks. Load whenever a user asks to graph, chart, visualize, compare, forecast, project, explain, or communicate data.
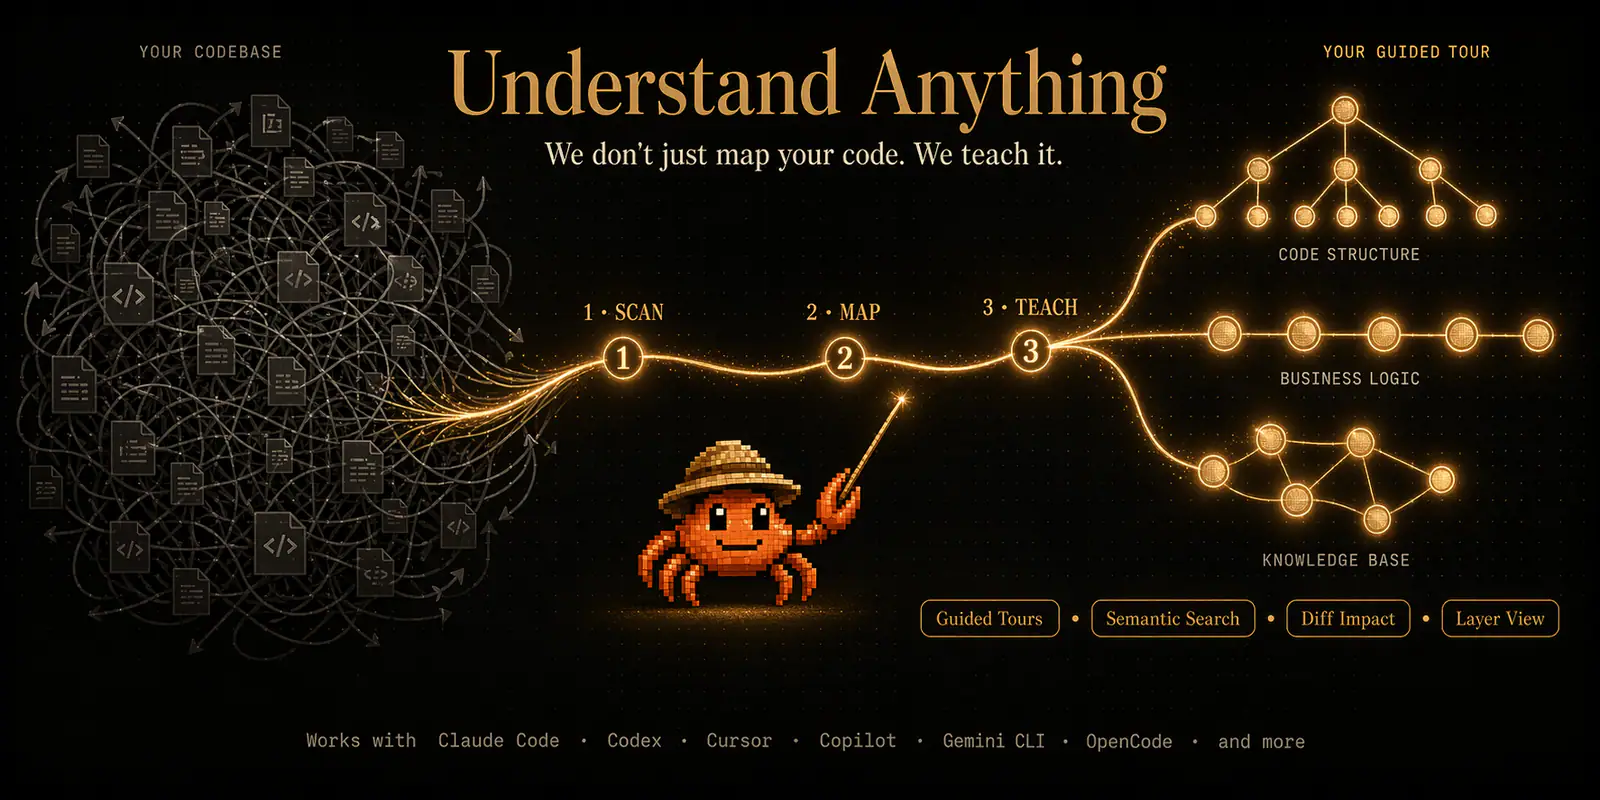
Understand Anything: Graph Dashboard
Launch an interactive dashboard for exploring a project’s saved knowledge graph.
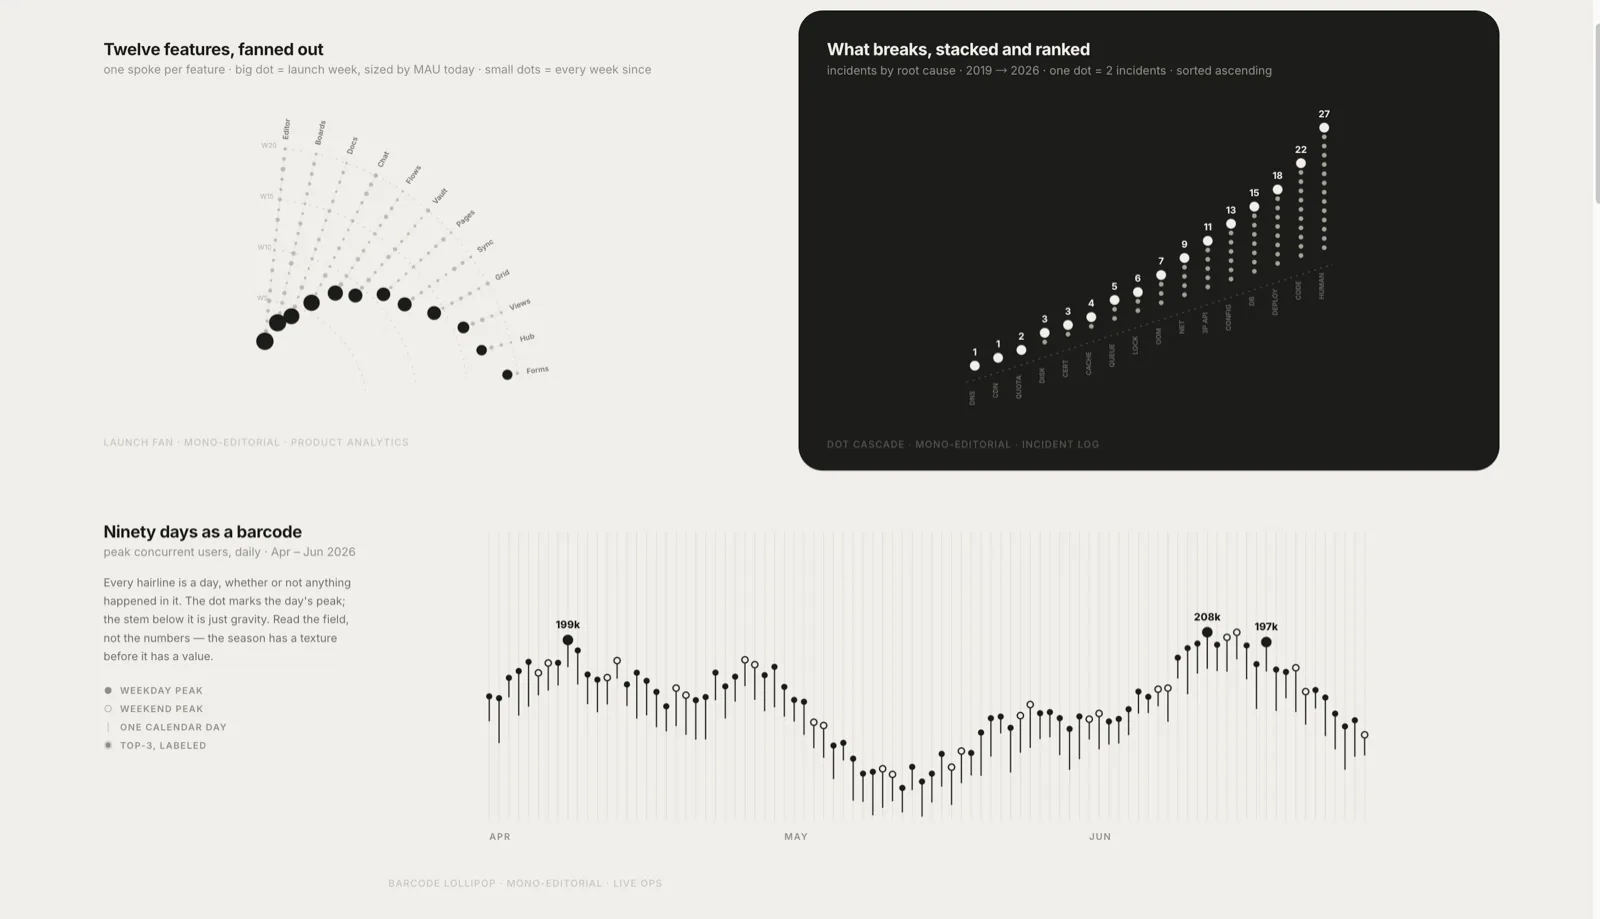
Lieflat Charts
Create template-driven HTML data visualizations, full-page reports, and HTML or PDF presentations with consistent typography and chart styles.
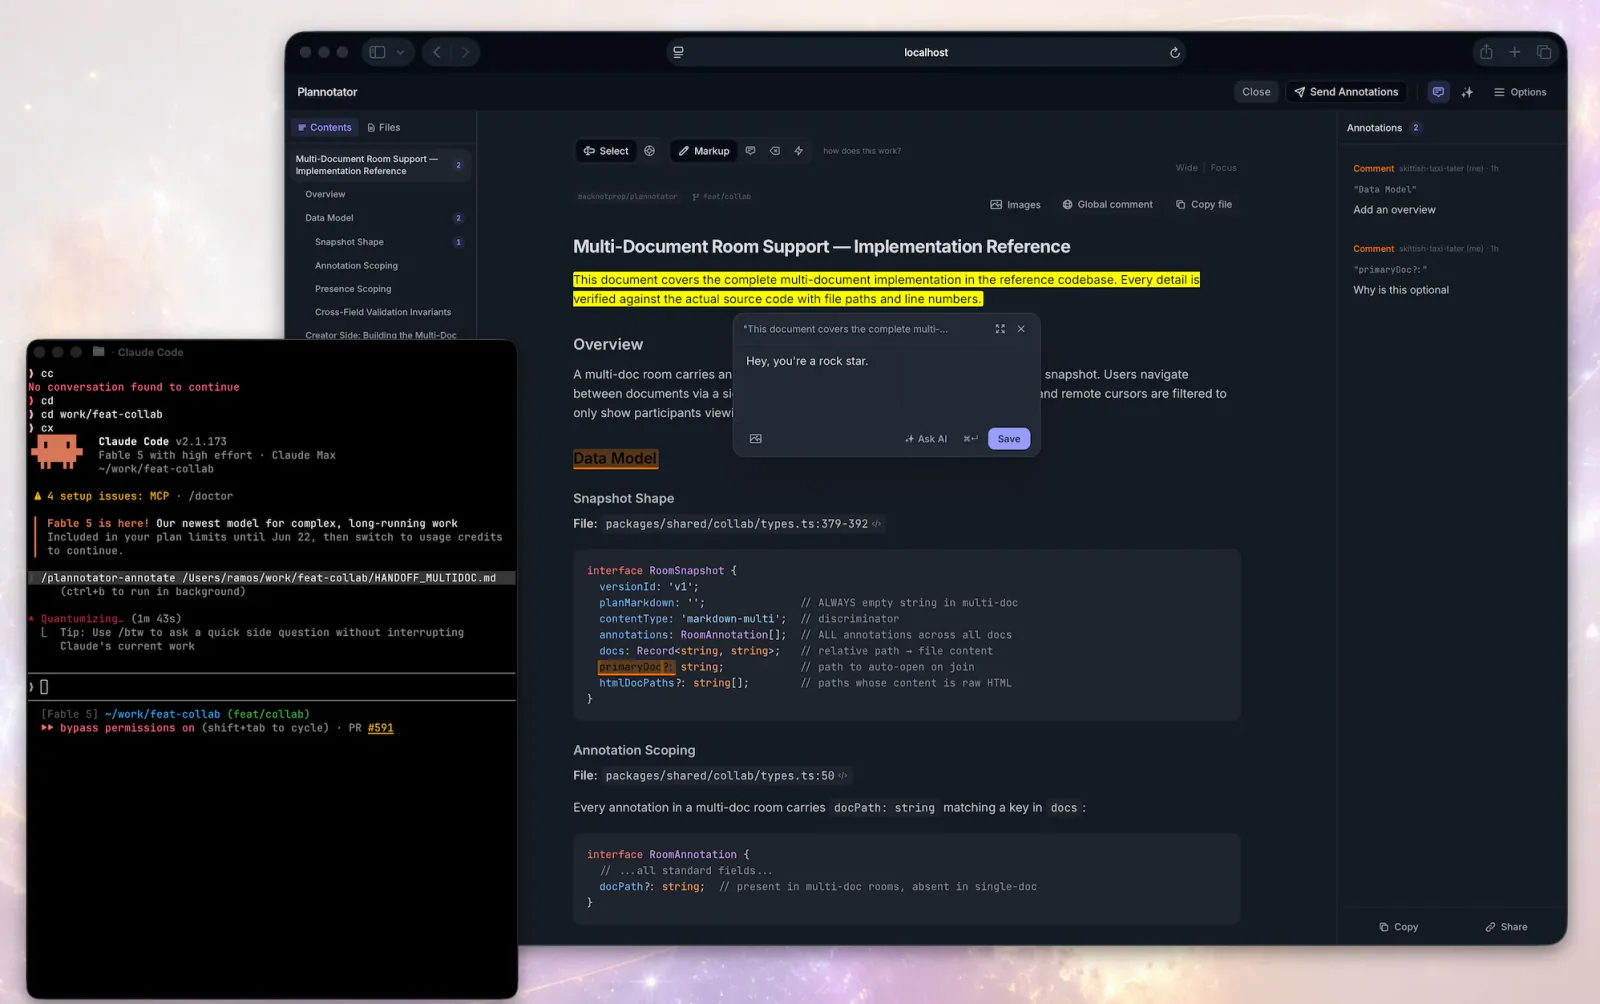
Plannotator — Visual Explanations
Generate self-contained HTML visualizations with Plannotator theming.
Create high-fidelity HTML prototypes, presentations, animations and visualizations with explicit design-direction review.
Create visual HTML articles, interfaces, images, motion videos and narrated web presentations, or retrieve local knowledge.
Build or redesign polished browser-rendered visual artifacts with HTML/CSS/JavaScript/React: pages, dashboards, prototypes, slide decks, animations, UI mockups, and data visualizations.
Eine kleine, sorgfältig gestaltete Bibliothek. Weitere Skills folgen.