Ship TanStack Charts with meaningful accessibility, deterministic SSR and hydration, correct adapter lifecycle, renderer and export choices, exact package subpaths, and explicit React Native validation.
870Звёзды57Форки
Последний push репозитория
Авторские процессы для сайтов, изображений, презентаций и анимации.
Ship TanStack Charts with meaningful accessibility, deterministic SSR and hydration, correct adapter lifecycle, renderer and export choices, exact package subpaths, and explicit React Native validation.
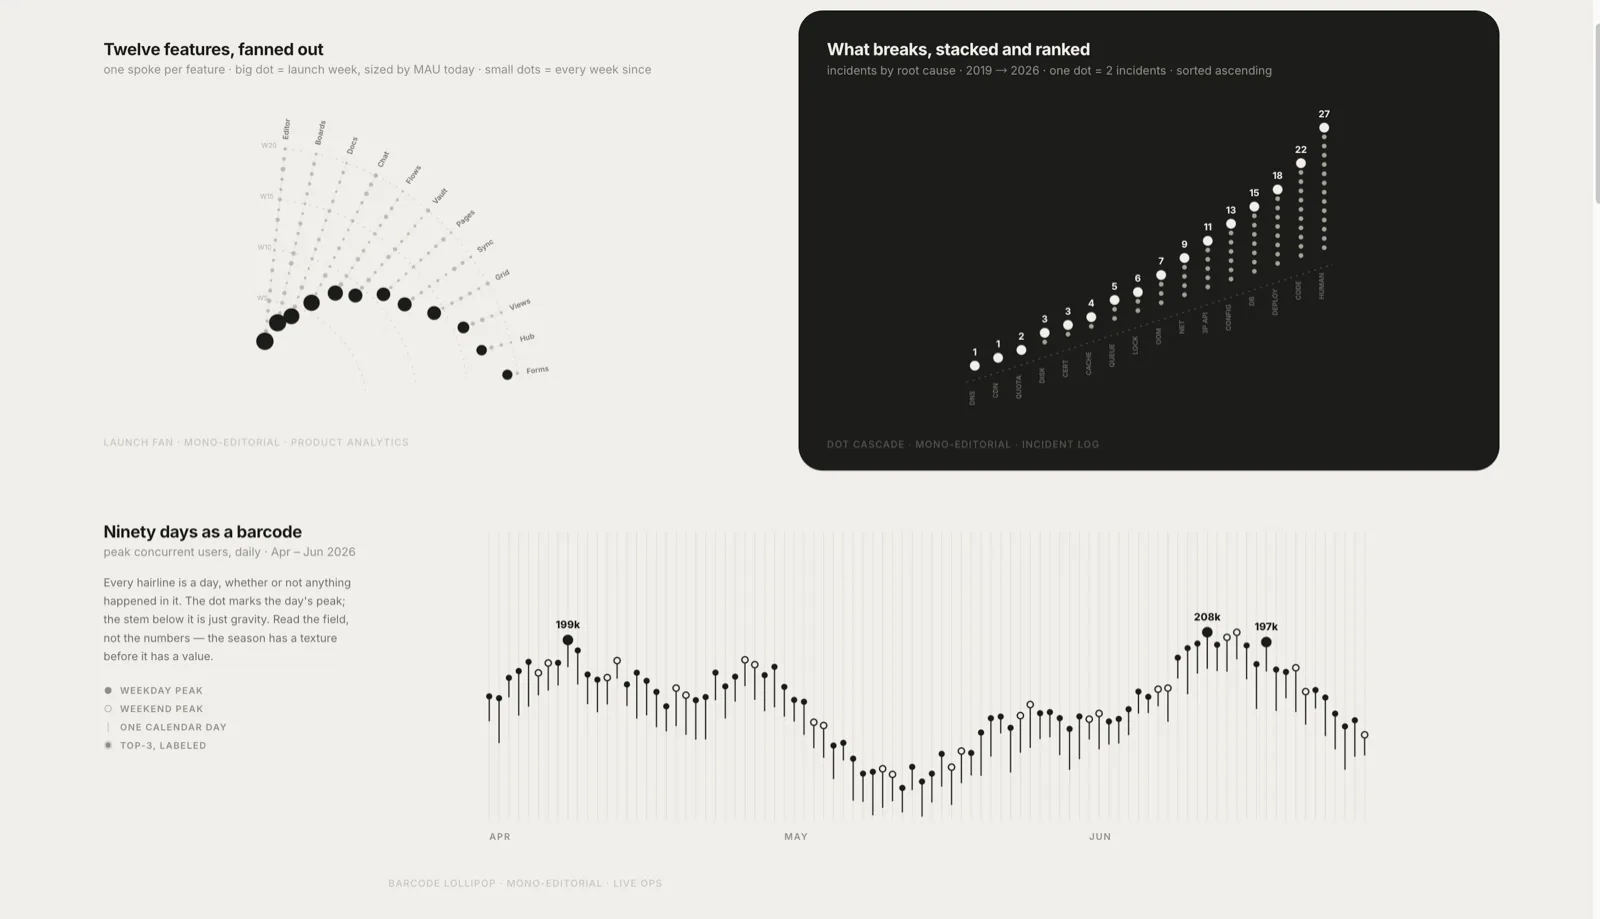
Create template-driven HTML data visualizations, full-page reports, and HTML or PDF presentations with consistent typography and chart styles.
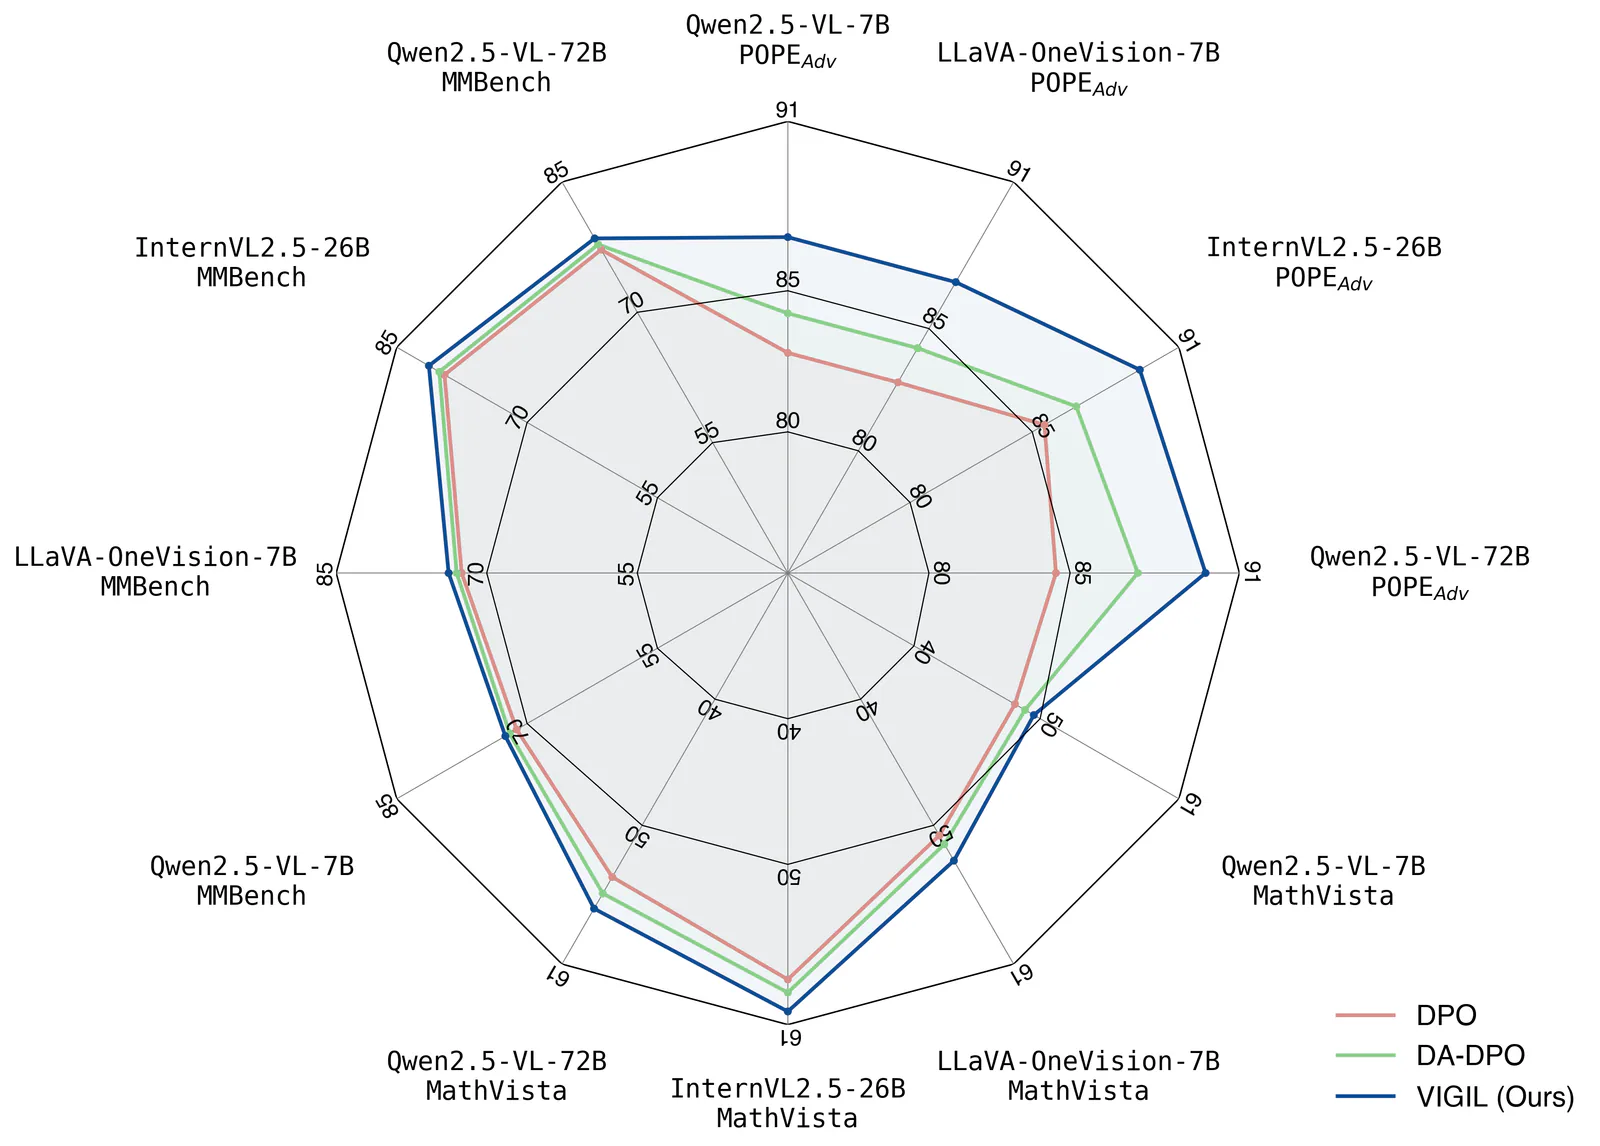
Create publication-style Matplotlib charts with an AI agent, using scientific plotting conventions, reference scripts and print or vector export guidance.
research skill for Claude AI. Grade A. This skill should be used when analyzing weekly price charts for stocks, stock indices, cryptocurrencies, or forex pairs. Use this skill when the user provides chart images and requests technical analysis, trend identification, support/resistance levels, scenario planning, or probability assessments based purely on chart data without consideration of news or fundamental factors.
Create narrated paper-collage explainers with Remotion, word-timed animation, charts and audio.
Create an HTML dashboard with KPI cards, charts and progress indicators.

Create editorial diagrams in your brand with an AI agent. Supports architecture, flowcharts, data charts, and redraws from Mermaid, draw.io, and Excalidraw, with HTML, SVG, and PNG output.
Create patent-style flowcharts and block diagrams with reference numbers.
Create an HTML flowchart with process nodes, decisions and connectors.
Deterministic design critique for HTML/CSS screens. Runs 73 slop guards extracted from the set of rules professional designers use in production-grade designs to catch the tells that make UI read as AI-generated (gradient-clipped headlines, the default indigo accent, puffy shadows, emoji icons, fake dot charts and decorated gauges, badges floated over the hero, eyebrow kickers above the H1, fake magazine mastheads, colored edge-stripe rails, two-tone headlines, over-designed list rows, layout-collapse bugs, em-dash copy, placeholder imagery), auto-fixes what can be safely rewritten, and reports the rest with concrete edits. Use whenever generated or hand-written HTML/CSS is about to be shown, exported, shipped, or committed, or when asked to critique a design, check it for slop, or give a second opinion on a generated screen.

Create scientific figures in Python or R, with multi-panel layout checks, editable outputs and optional AI schematic drafts.
Build consulting presentations from HTML slide parts with a design rulebook, automated checks, PDF output and an optional editable PowerPoint conversion.
SVG diagramming conventions blending a technical look with CJK-friendly typography. Use when creating flowcharts, architecture diagrams, and similar SVG figures. For one-shot generation, prefer invoking it from a subagent so the main context does not have to carry this skill plus the SVG XML; for multi-round tweaking, use it directly in the main context.
Choose an honest visualization from a user story, metric, comparison, projection, target, or explanatory goal before selecting TanStack Charts marks. Load whenever a user asks to graph, chart, visualize, compare, forecast, project, explain, or communicate data.
Create Marp presentations from Markdown with SVG charts, dashboard components and reference decks, then export to HTML, PDF or PowerPoint.
Create and edit PowerPoint decks with varied layouts, editable charts and document validation.
Map feature flows, identify repeated concerns, and propose a unified architecture with source-linked handoff prompts.
Use this skill whenever the user wants to create, customize, or troubleshoot G2 v5 chart visualizations. Triggers include: any mention of 'G2', 'antv g2', '@antv/g2', 'G2 chart', 'G2 可视化', or requests to produce charts like bar charts (柱状图), line charts (折线图), pie charts (饼图), scatter plots (散点图), area charts (面积图), heatmap (热力图), radar charts (雷达图), treemap (矩形树图), funnel charts (漏斗图), sankey diagrams (桑基图), gauge (仪表盘), wordcloud (词云), boxplot (箱线图), as well as G2-specific topics like encode channels, scale config, coordinate systems, transforms, interactions, themes, labels, and animations. Also use when debugging G2 rendering errors, V4→V5 migration issues, or chart type selection. Do NOT use for G6 graph/network visualization, X6 editor diagrams, or S2 pivot tables.
Read, create, or edit Excel spreadsheets (.xlsx/.xlsm) — sheet data, formulas, styles, charts, multi-sheet workbooks — and bulk .csv/.tsv tables; use whenever a spreadsheet is the input or the deliverable (extract/analyze data, add columns/formulas/formatting/charts, clean messy tables, build from scratch), but not for Google Sheets API or Word/PDF/script outputs.
Read, create, or edit PowerPoint .pptx decks — build slides from an outline, extract slide text/speaker notes, edit shapes/tables/charts, replace images, or export to PDF/images.
Небольшая библиотека, созданная с заботой. Скоро появятся новые навыки.