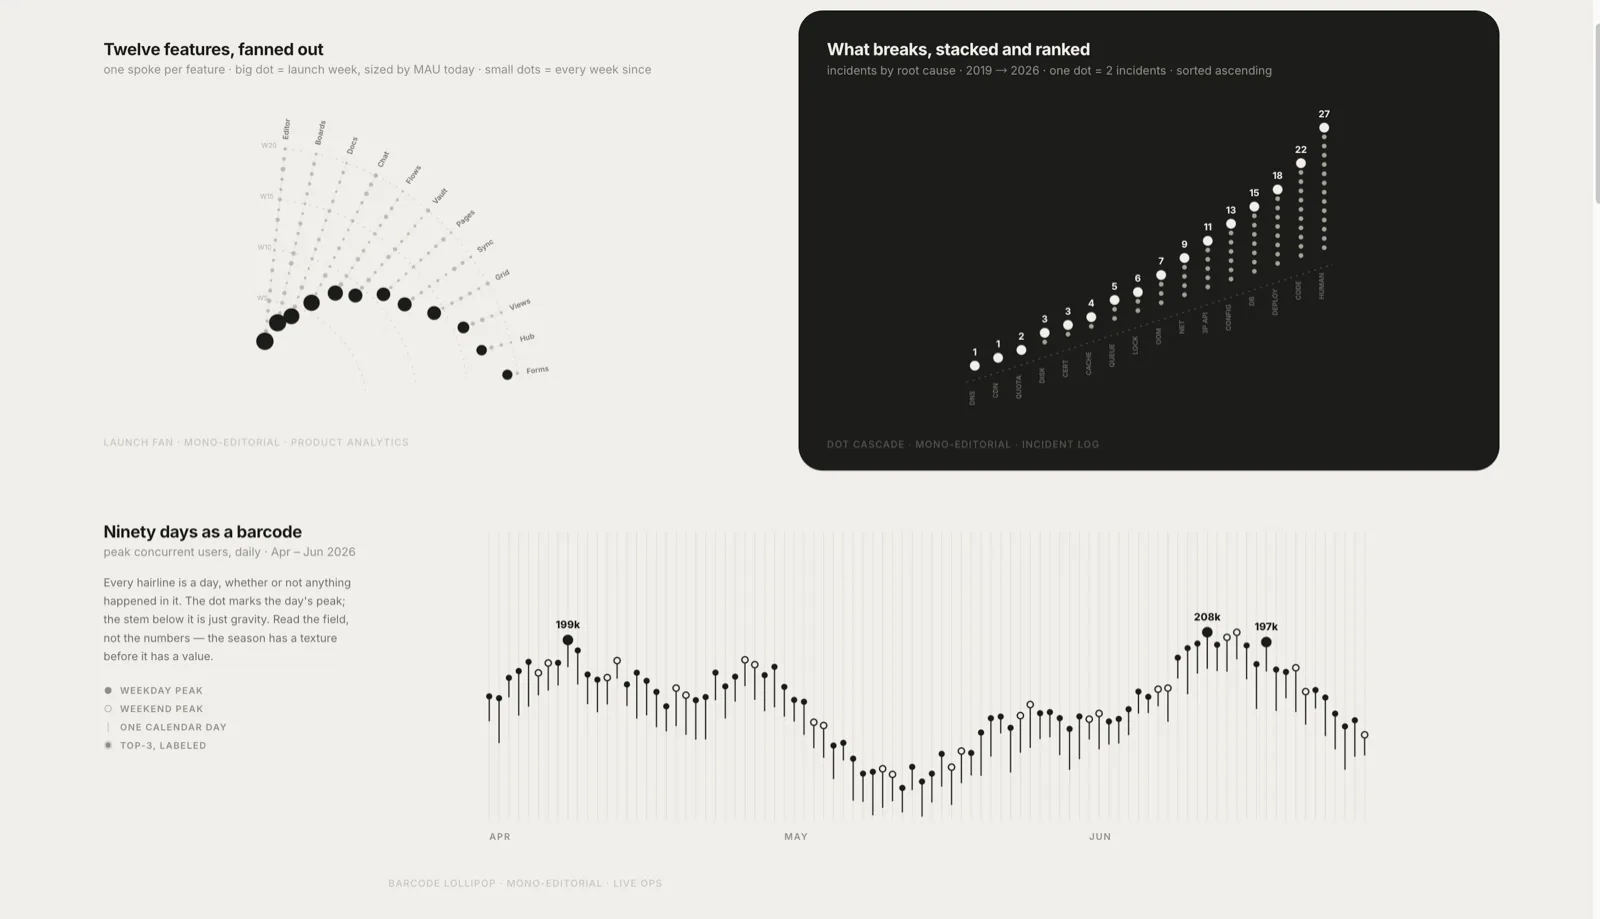
Choose an honest visualization from a user story, metric, comparison, projection, target, or explanatory goal before selecting TanStack Charts marks. Load whenever a user asks to graph, chart, visualize, compare, forecast, project, explain, or communicate data.
Use this skill whenever the user wants to create, customize, or troubleshoot G2 v5 chart visualizations. Triggers include: any mention of 'G2', 'antv g2', '@antv/g2', 'G2 chart', 'G2 可视化', or requests to produce charts like bar charts (柱状图), line charts (折线图), pie charts (饼图), scatter plots (散点图), area charts (面积图), heatmap (热力图), radar charts (雷达图), treemap (矩形树图), funnel charts (漏斗图), sankey diagrams (桑基图), gauge (仪表盘), wordcloud (词云), boxplot (箱线图), as well as G2-specific topics like encode channels, scale config, coordinate systems, transforms, interactions, themes, labels, and animations. Also use when debugging G2 rendering errors, V4→V5 migration issues, or chart type selection. Do NOT use for G6 graph/network visualization, X6 editor diagrams, or S2 pivot tables.
Build or redesign polished browser-rendered visual artifacts with HTML/CSS/JavaScript/React: pages, dashboards, prototypes, slide decks, animations, UI mockups, and data visualizations.
web-design
ui-design
15 milEstrelas1,7 milForks
Último push do repositório
Uma pequena biblioteca feita com cuidado. Mais skills estão a caminho.