Create an HTML dashboard with KPI cards, charts and progress indicators.
694Étoiles98Forks
Dernier push du dépôt
Des workflows originaux pour sites web, images, présentations et animations.
Create an HTML dashboard with KPI cards, charts and progress indicators.
Design and refine dashboards, SaaS apps and admin interfaces with deliberate hierarchy, shared tokens, complete states and reusable design memory.
Use for UI design and implementation work to avoid generic AI-looking interfaces. Provides anti-slop rules, a required discovery phase before coding, and guidance for layout, typography, color, motion, accessibility, dashboards, tables, landing pages, theming, and polish. Trigger when editing UI code or reviewing and refining components, pages, screens, layouts, animations, responsive behavior, or design systems.
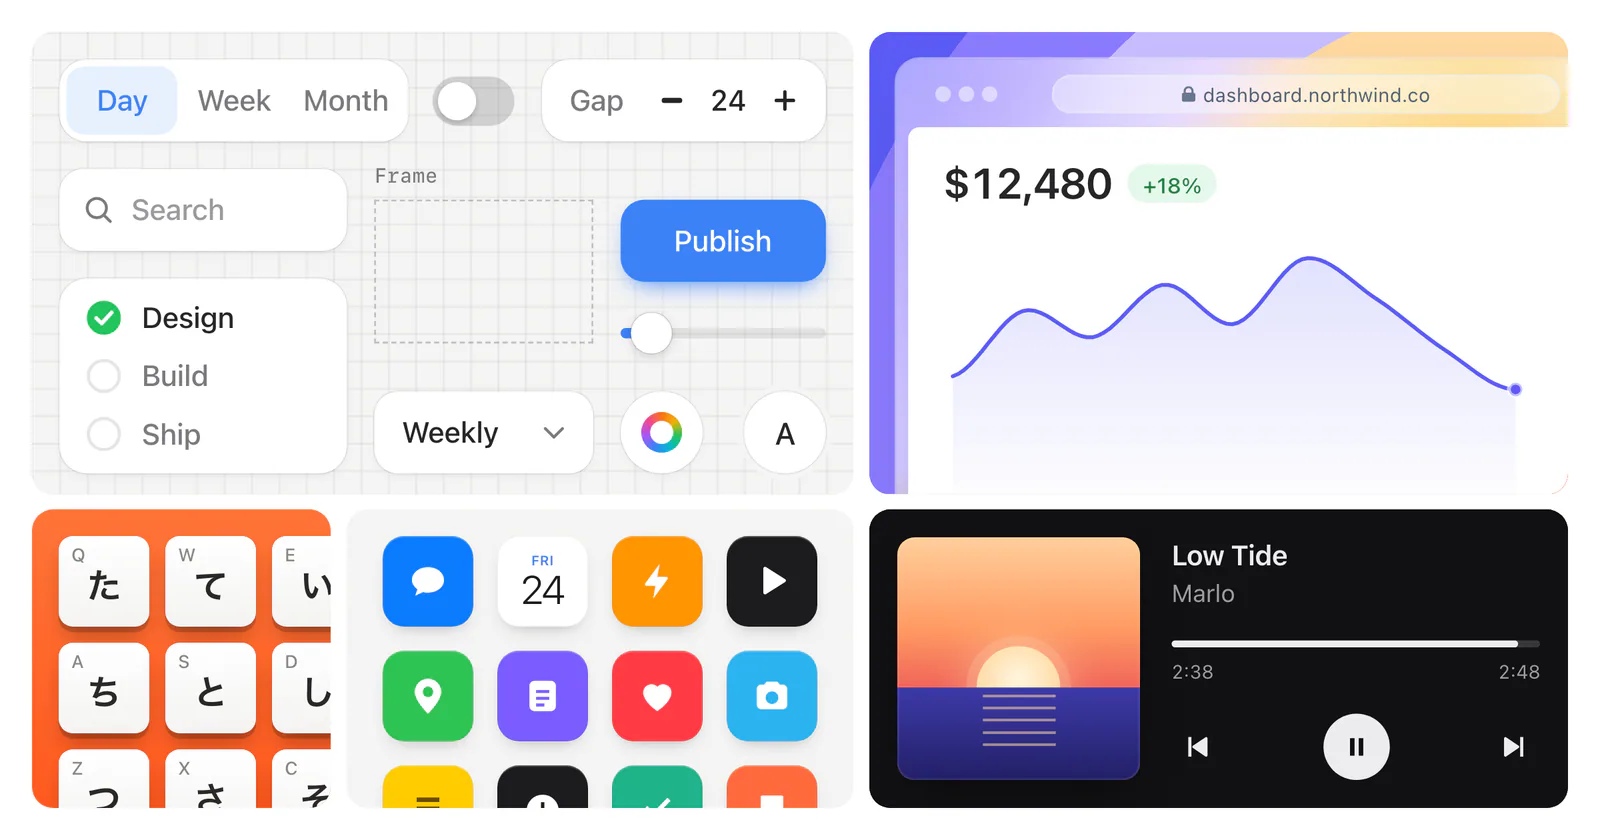
Build product UI illustrations and animated cursor demos with React: feature cards, browser windows, dashboards, phone screens and bento grids.
Query Prometheus through Grafana, investigate infrastructure metrics and maintain dashboards as code.
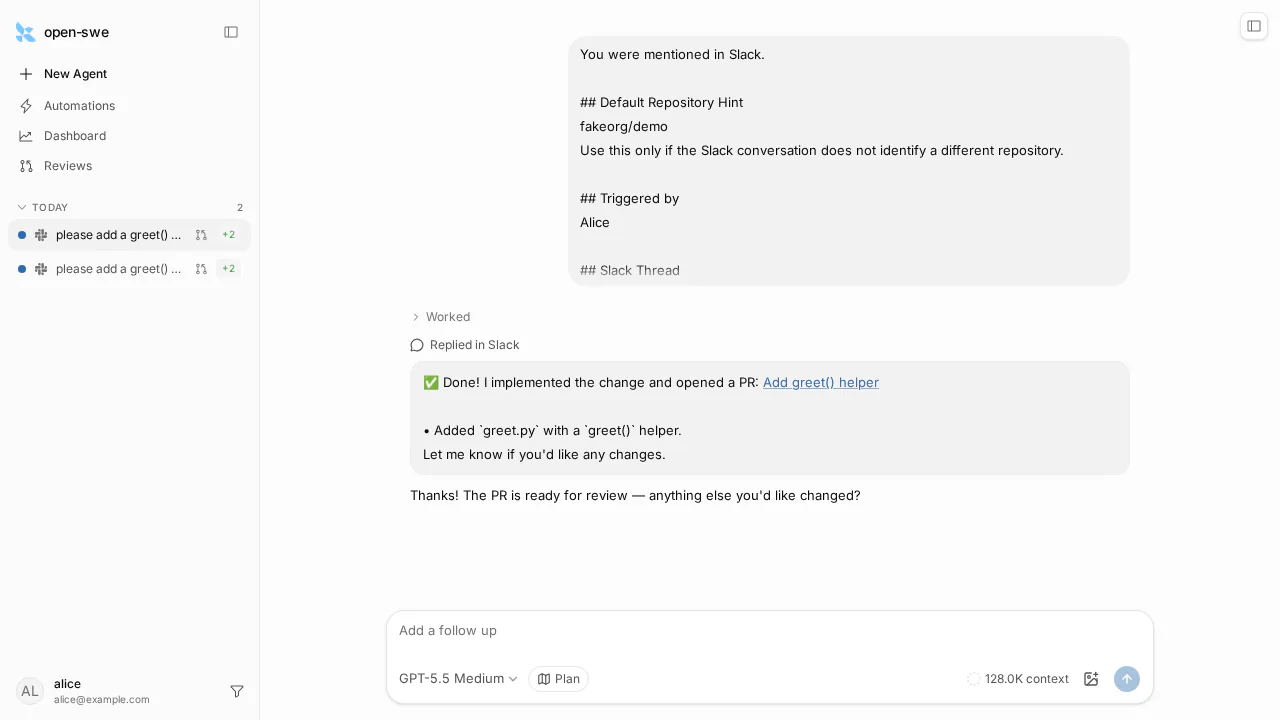
Build themed HTML plan artifacts, dashboard iframes and Slack attachments for the Open SWE runtime.
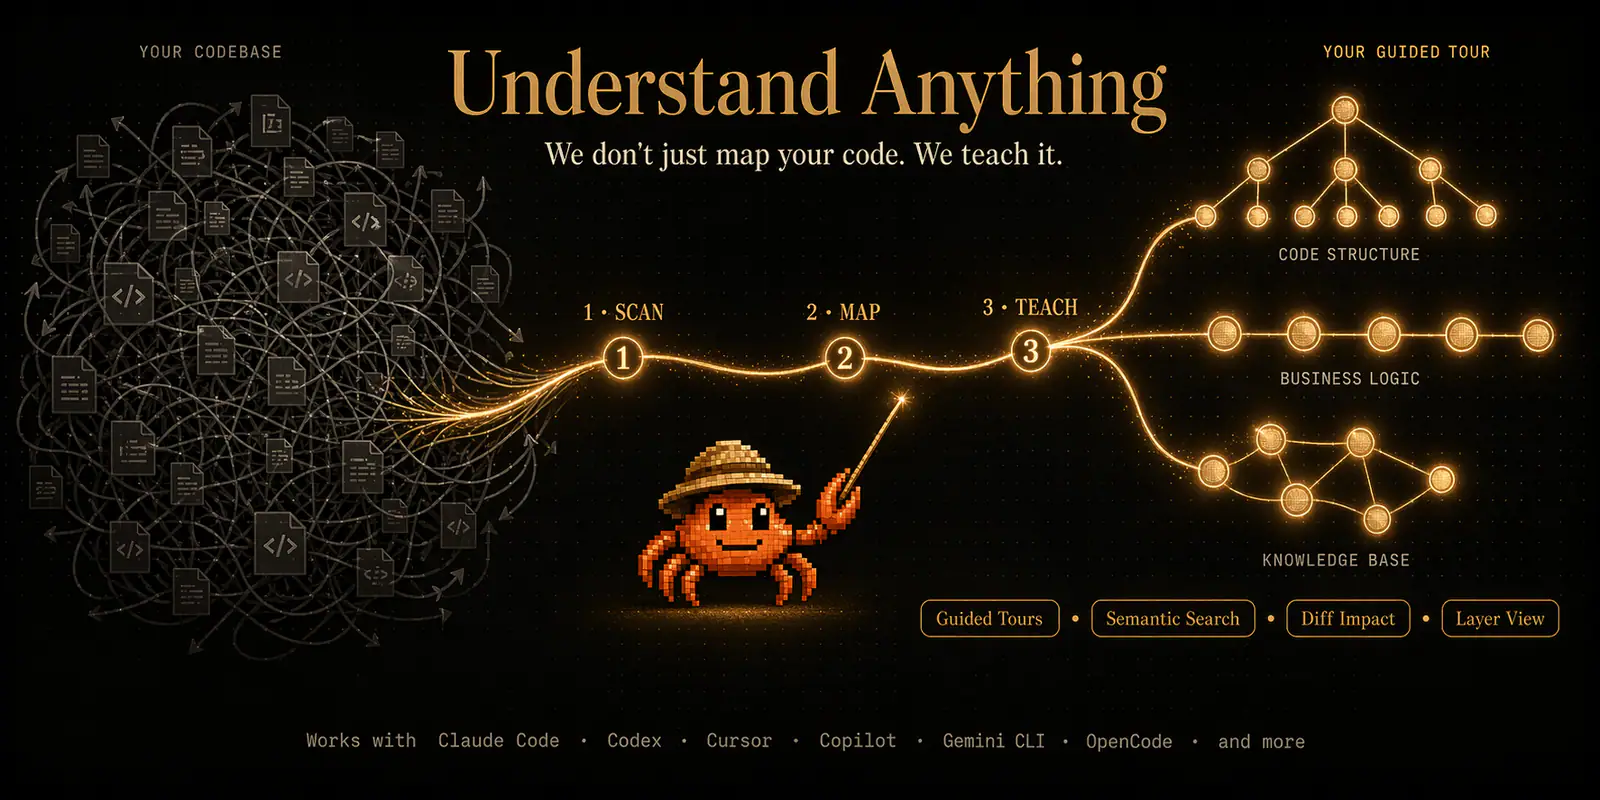
Launch an interactive dashboard for exploring a project’s saved knowledge graph.
Build or redesign polished browser-rendered visual artifacts with HTML/CSS/JavaScript/React: pages, dashboards, prototypes, slide decks, animations, UI mockups, and data visualizations.
Une petite bibliothèque créée avec soin. D’autres skills arrivent bientôt.