Explorer les skills

Des workflows originaux pour sites web, images, présentations et animations.

8 skillspour “data-visualization”
Effacer les filtres
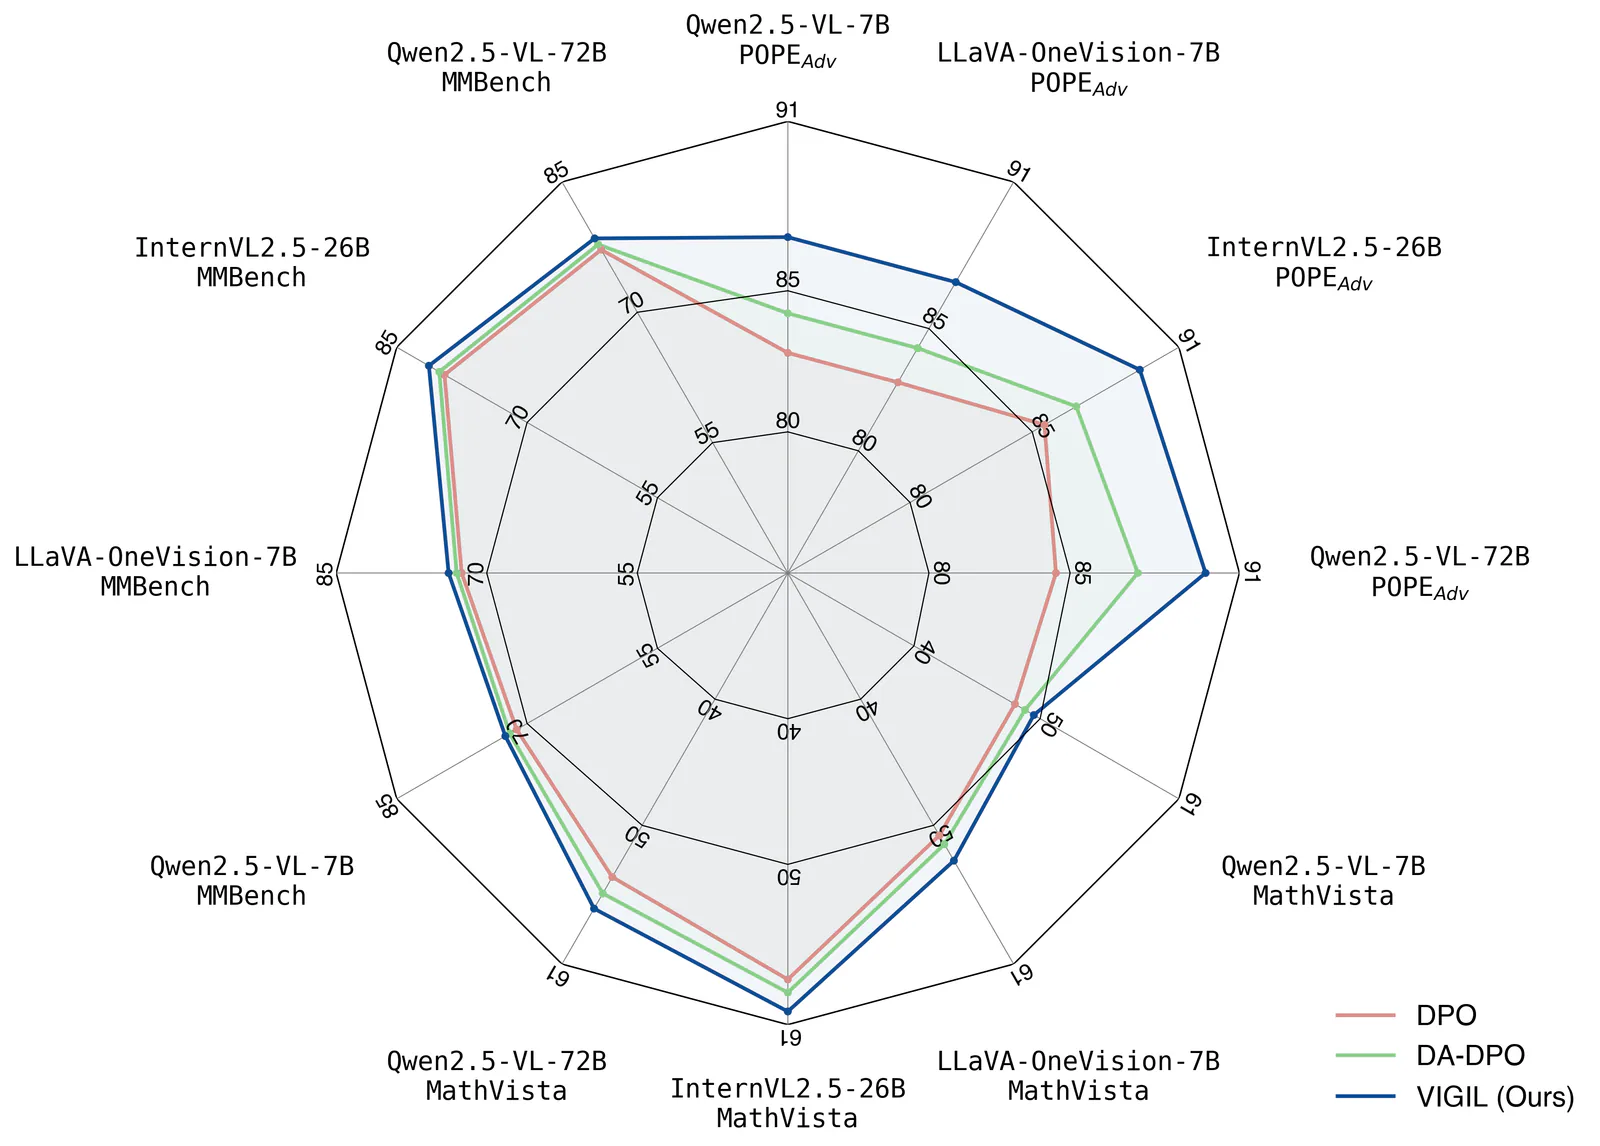
Chen Liu's VIGIL radar comparison, reused from the figures4papers README.
Gratuit
Images

Figures for Papers

Create publication-style Matplotlib charts with an AI agent, using scientific plotting conventions, reference scripts and print or vector export guidance.

11,1 kÉtoiles767Forks
Dernier push du dépôt

Audit and fix visual hierarchy, spacing, color, and depth in web UIs. Use when the user mentions "my UI looks off" (or amateur/unprofessional), "fix the design", "Tailwind styling", "color palette", "visual hierarchy", "design system", "spacing scale", or "component styling". Also trigger when building consistent design tokens, creating dark mode themes, improving data-visualization clarity, or polishing UI details before launch. Covers grayscale-first workflow, constrained design scales, shadows, and component styling. For typeface selection, see web-typography. For usability audits, see ux-heuristics.
  • ui design
  • frontend
2,7 kÉtoiles266Forks
Dernier push du dépôt

Dashboard Creator

mhattingpete

Create an HTML dashboard with KPI cards, charts and progress indicators.

  • dashboards
  • data-visualization
694Étoiles98Forks
Dernier push du dépôt
SeeCode Diagrams — Bar chart export
Gratuit
Images

SeeCode Diagrams

Create animated and explorable diagrams from compact JSON specifications, with scripted layout, styling, motion, and export workflows.

934Étoiles68Forks
Dernier push du dépôt
Nature Skills repository banner with a research robot and its literature, writing, review and figure workflows.
Gratuit
Images

Nature Figure

Create scientific figures in Python or R, with multi-panel layout checks, editable outputs and optional AI schematic drafts.

53,3 kÉtoiles2,8 kForks
Dernier push du dépôt
Gratuit
Web et interfaces

AntV L7

Build WebGL map applications with interactive geographic layers, animations, and spatial datasets.

4,1 kÉtoiles653Forks
Dernier push du dépôt
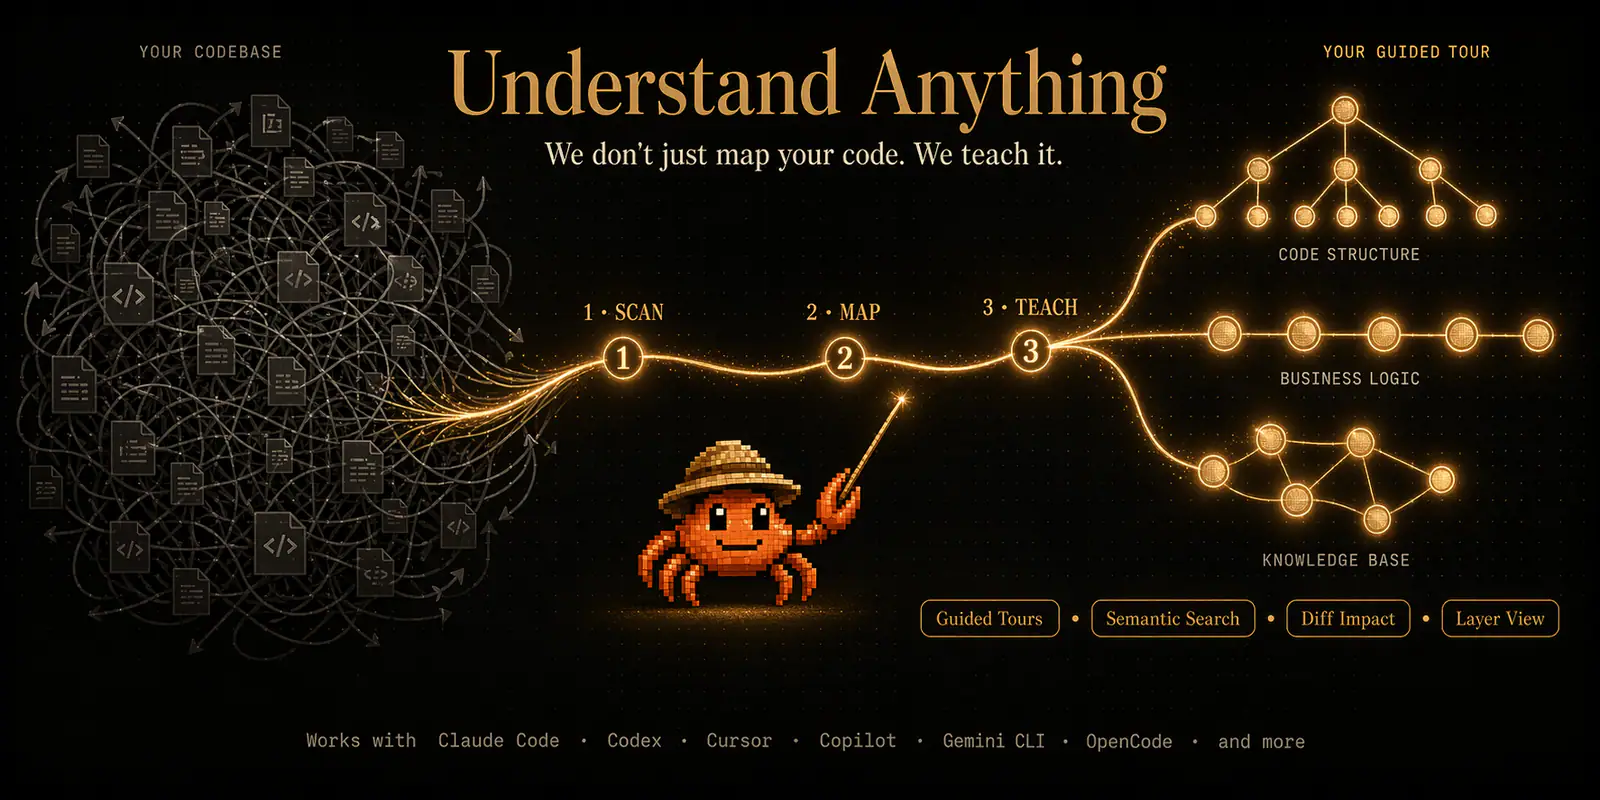
Understand Anything codebase graph
Gratuit
Recherche et données

Understand Anything: Graph Dashboard

Launch an interactive dashboard for exploring a project’s saved knowledge graph.

92,3 kÉtoiles7,9 kForks
Dernier push du dépôt
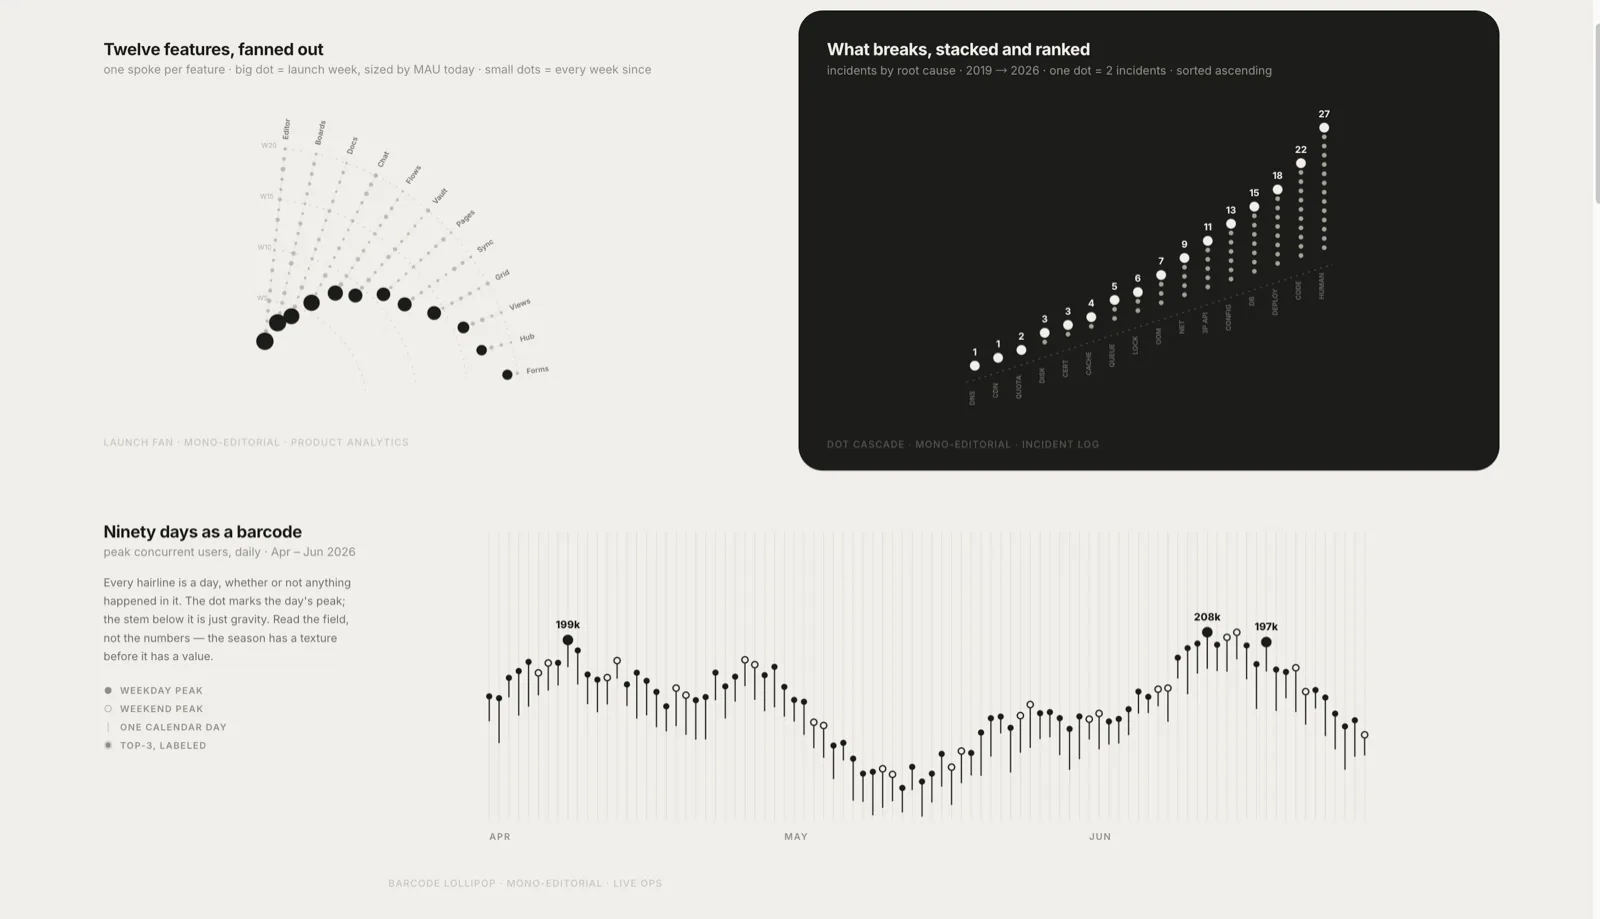
Lieflat Charts — official illustration from the upstream README
Gratuit
Documents

Lieflat Charts

Create template-driven HTML data visualizations, full-page reports, and HTML or PDF presentations with consistent typography and chart styles.

6,8 kÉtoiles414Forks
Dernier push du dépôt

Une petite bibliothèque créée avec soin. D’autres skills arrivent bientôt.