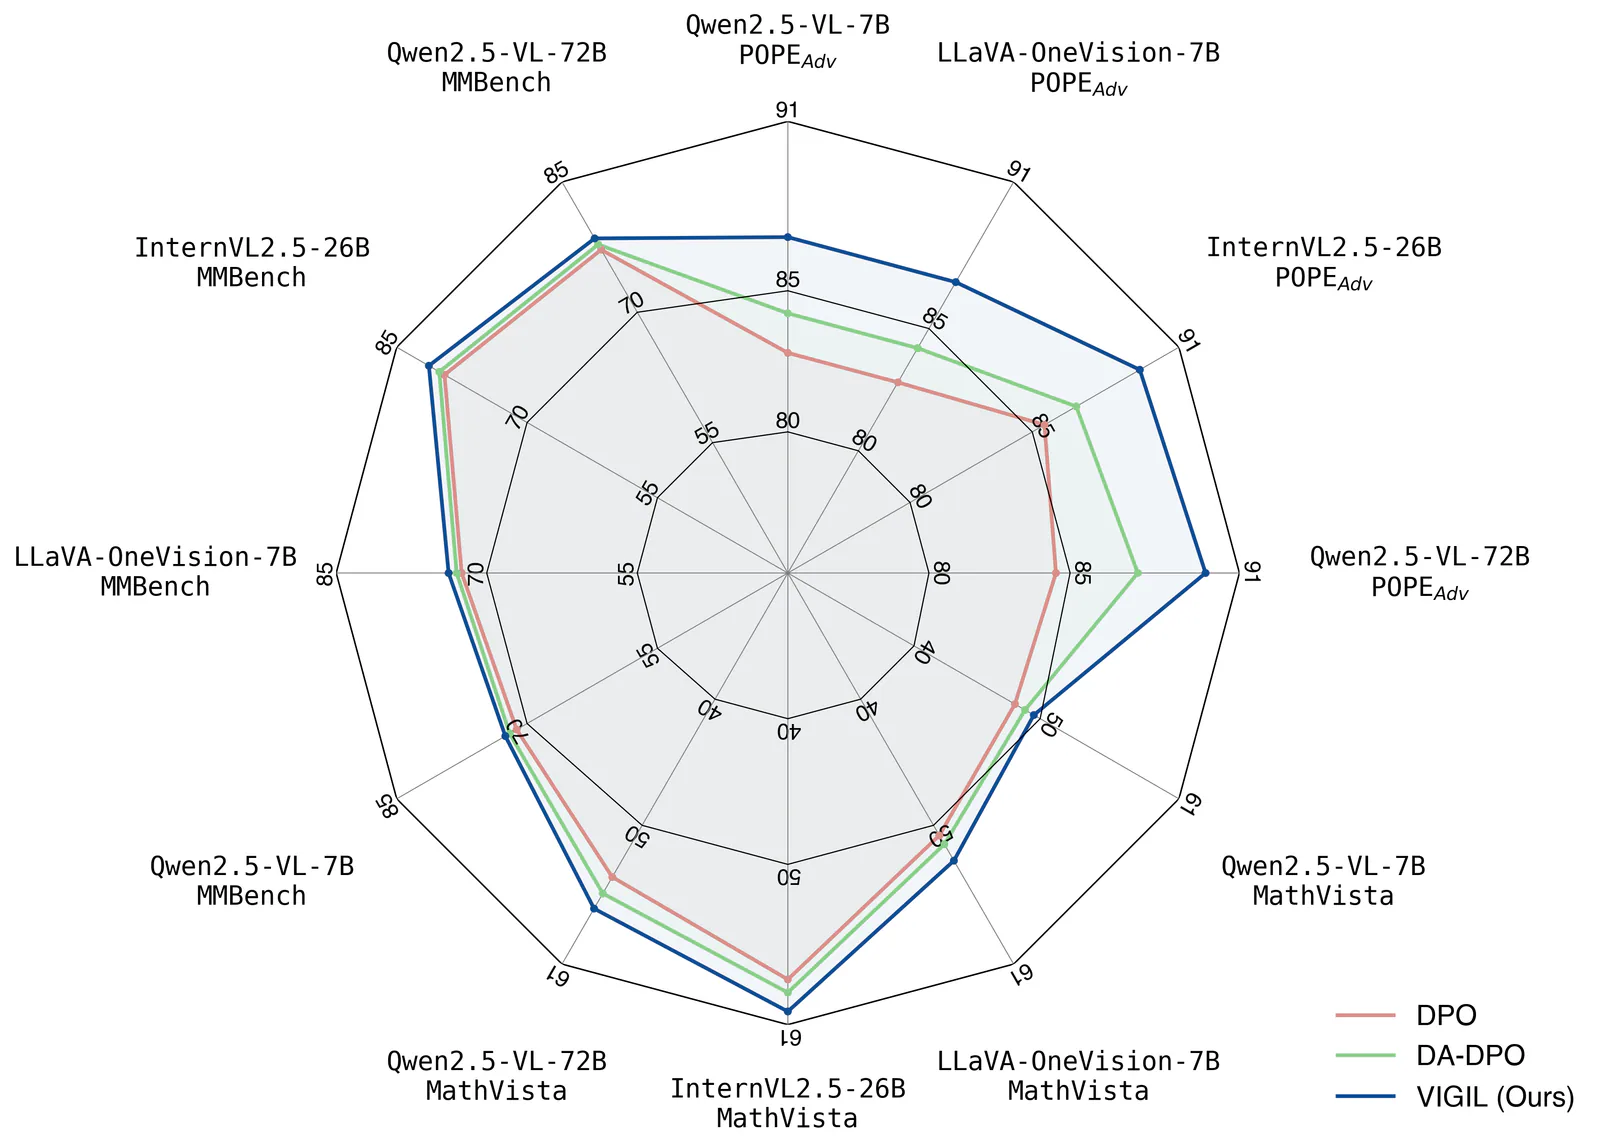
Chen Liu's VIGIL radar comparison, reused from the figures4papers README.
Project screenshotsAbout this Skill
Figures for Papers is Chen Liu's collection of Python plotting scripts and scientific-figure-making Agent Skill. The Skill guides an agent through publication-oriented Matplotlib styling, chart layouts and export conventions. Its references connect these rules to concrete figure_* projects, so an agent can adapt an existing script or implement the documented helpers for your own data.
Why we picked it
The useful part is the connection between plotting guidance and real figure scripts: you can ask an agent to adapt a bar, radar or line-chart example while keeping fonts, colors, legends and exports consistent. Start with your actual data, labels, intended figure size and output formats. This is a plotting Skill and reference repository, with a noncommercial license.
What it helps with
- Researchers comparing methods, benchmarks or ablations in papers and reports.
- Teams standardizing typography, legends, colors and export settings across a set of figures.
- Matplotlib users who want an agent to adapt plotting scripts while keeping the data and code reproducible.
From your data to a plotting script
Open the repository in your agent and point it to scientific-figure-making/SKILL.md. Describe the chart, input data and intended publication layout. The agent reads the relevant style and API references, adapts a figure_* script or writes an implementation, then runs the script and inspects the exported result.
Plotting patterns
References cover grouped bars, trend lines, scatter plots, heatmaps and multi-panel layouts. Radar and polar comparisons are linked to the VIGIL example scripts.
Consistent figure styling
The guidance specifies font fallbacks, semantic colors, axis styling, shared legend panels and print-safe edges or hatching. Apply these choices at the intended final display size.
Scientific Figure Making SkillAPI conventionsReference scripts
Script, raster and vector outputs
Ask for the plotting script together with PNG and PDF outputs, so you can change the source data and rerun it. The documented export conventions also cover SVG and EPS, with 300 DPI as a common raster setting and higher resolution for dense panels. Check labels, legends, error bars and units against the original data before using the figure.
The API is an implementation guide
Functions such as apply_publication_style, make_grouped_bar and finalize_figure are specified in the references. The repository does not ship a shared Python module that already implements all of those helpers. Ask the agent to implement them in your project or adapt the real example code; copying a tutorial call alone is insufficient.
Use by path or link into your agent
| Command | What it helps with |
|---|---|
mkdir -p .claude/skills
ln -s "$PWD/scientific-figure-making" .claude/skills/scientific-figure-making | Claude Code: project installation. Final entry: .claude/skills/scientific-figure-making/SKILL.md. |
mkdir -p .agents/skills
ln -s "$PWD/scientific-figure-making" .agents/skills/scientific-figure-making | Codex CLI: project installation. Final entry: .agents/skills/scientific-figure-making/SKILL.md. |
mkdir -p .cursor/skills
ln -s "$PWD/scientific-figure-making" .cursor/skills/scientific-figure-making | Cursor: project installation. Final entry: .cursor/skills/scientific-figure-making/SKILL.md. |
Clone and open the repository
Clone the repository and open it in your AI coding agent. You can use the Skill directly by pointing the agent to scientific-figure-making/SKILL.md and its references.
git clone https://github.com/ChenLiu-1996/figures4papers.git
cd figures4papers
Optional project-level symlink
From the repository root, run the matching command below. The root comes from the shared agent catalog, and the installed folder keeps the upstream name scientific-figure-making. Keep the repository at the linked location and restart or refresh the agent.
A useful first request
Use scientific-figure-making to plot the attached benchmark CSV as three grouped-bar panels with a shared legend. Preserve the source values and show the supplied uncertainty. Match the figures4papers font and color conventions, use the paper's target column width, and deliver the Python script, a 300-DPI PNG and a PDF. Implement any needed helpers rather than assuming an installed plotting module.
Author examples and noncommercial license
The gallery reuses Chen Liu's radar, bar and line-chart examples linked in the official README. These are the author's existing research figures. Display copies were placed on white backgrounds, resized and converted to WebP for this catalog; their chart content remains the author's original example.
The repository LICENSE is Creative Commons Attribution-NonCommercial 4.0 International (CC BY-NC 4.0). Retain attribution and the license link when sharing permitted material, and identify changes. Commercial use requires permission beyond this license. The linked license includes its warranty disclaimer.
Official repository and READMEAuthor's radar exampleAuthor's bars exampleAuthor's lines exampleRepository licenseCC BY-NC 4.0 terms
Before you use it
- An AI coding agent with local file access and shell execution, plus a Python 3 environment. Core plotting examples use Matplotlib and NumPy; individual scripts may need additional dependencies and input data.
- Supply the data, units, labels, target figure dimensions and export formats. LaTeX is needed only for scripts that enable text.usetex; confirm font availability or use a fallback font.
- The repository is available without a purchase under CC BY-NC 4.0. That license requires attribution and limits use to noncommercial purposes. Your AI service retains its own costs.
Supported agents
Frequently asked questions
Is this a one-click plotting application?
It is an Agent Skill and a reference-script repository. Your agent uses the instructions to write or adapt Python plotting code, and you run that code in a suitable environment.
Can it make interactive dashboards?
The Skill targets publication-oriented Matplotlib figures. Its documented scope excludes web-first visualization tools such as Plotly, Altair and Bokeh, as well as workflows dominated by 3D or geographic mapping.
Can I use it commercially?
The repository's CC BY-NC 4.0 license covers noncommercial uses subject to its conditions. Contact the author for permission if your intended use is commercial.
Official sources
Based on official documentation, with practical scenarios suggested by SkillHey.