Free
Documents
Lieflat Charts
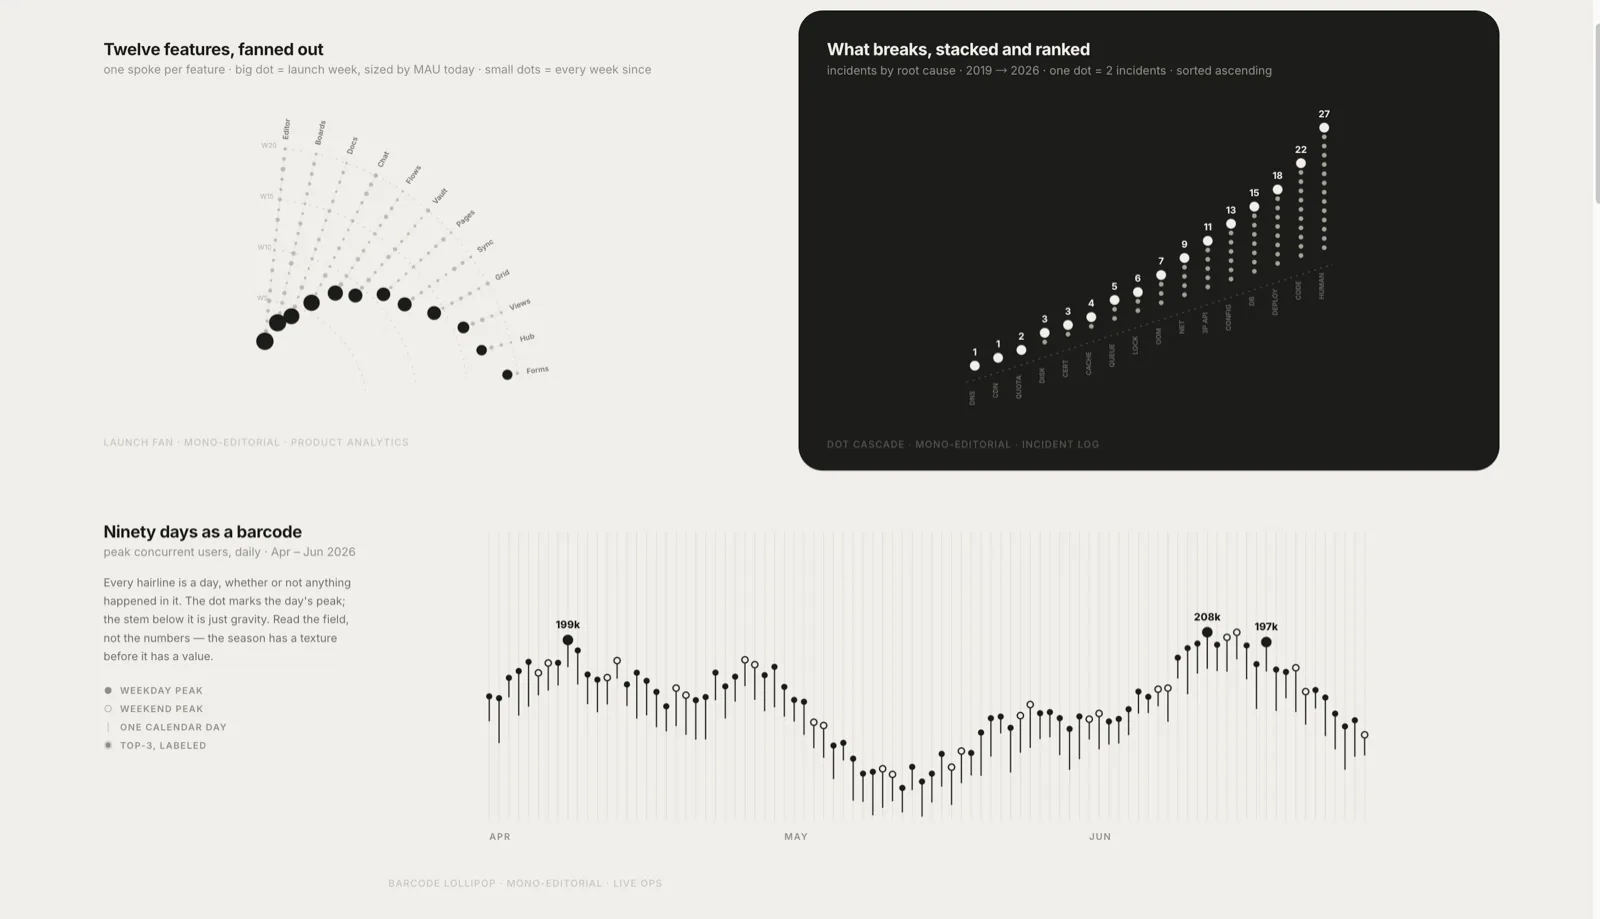
Create template-driven HTML data visualizations, full-page reports, and HTML or PDF presentations with consistent typography and chart styles.
6.4KStars388Forks
Repository last pushed
lieflat
Original workflows for websites, images, presentations, and everything in motion.
Create template-driven HTML data visualizations, full-page reports, and HTML or PDF presentations with consistent typography and chart styles.
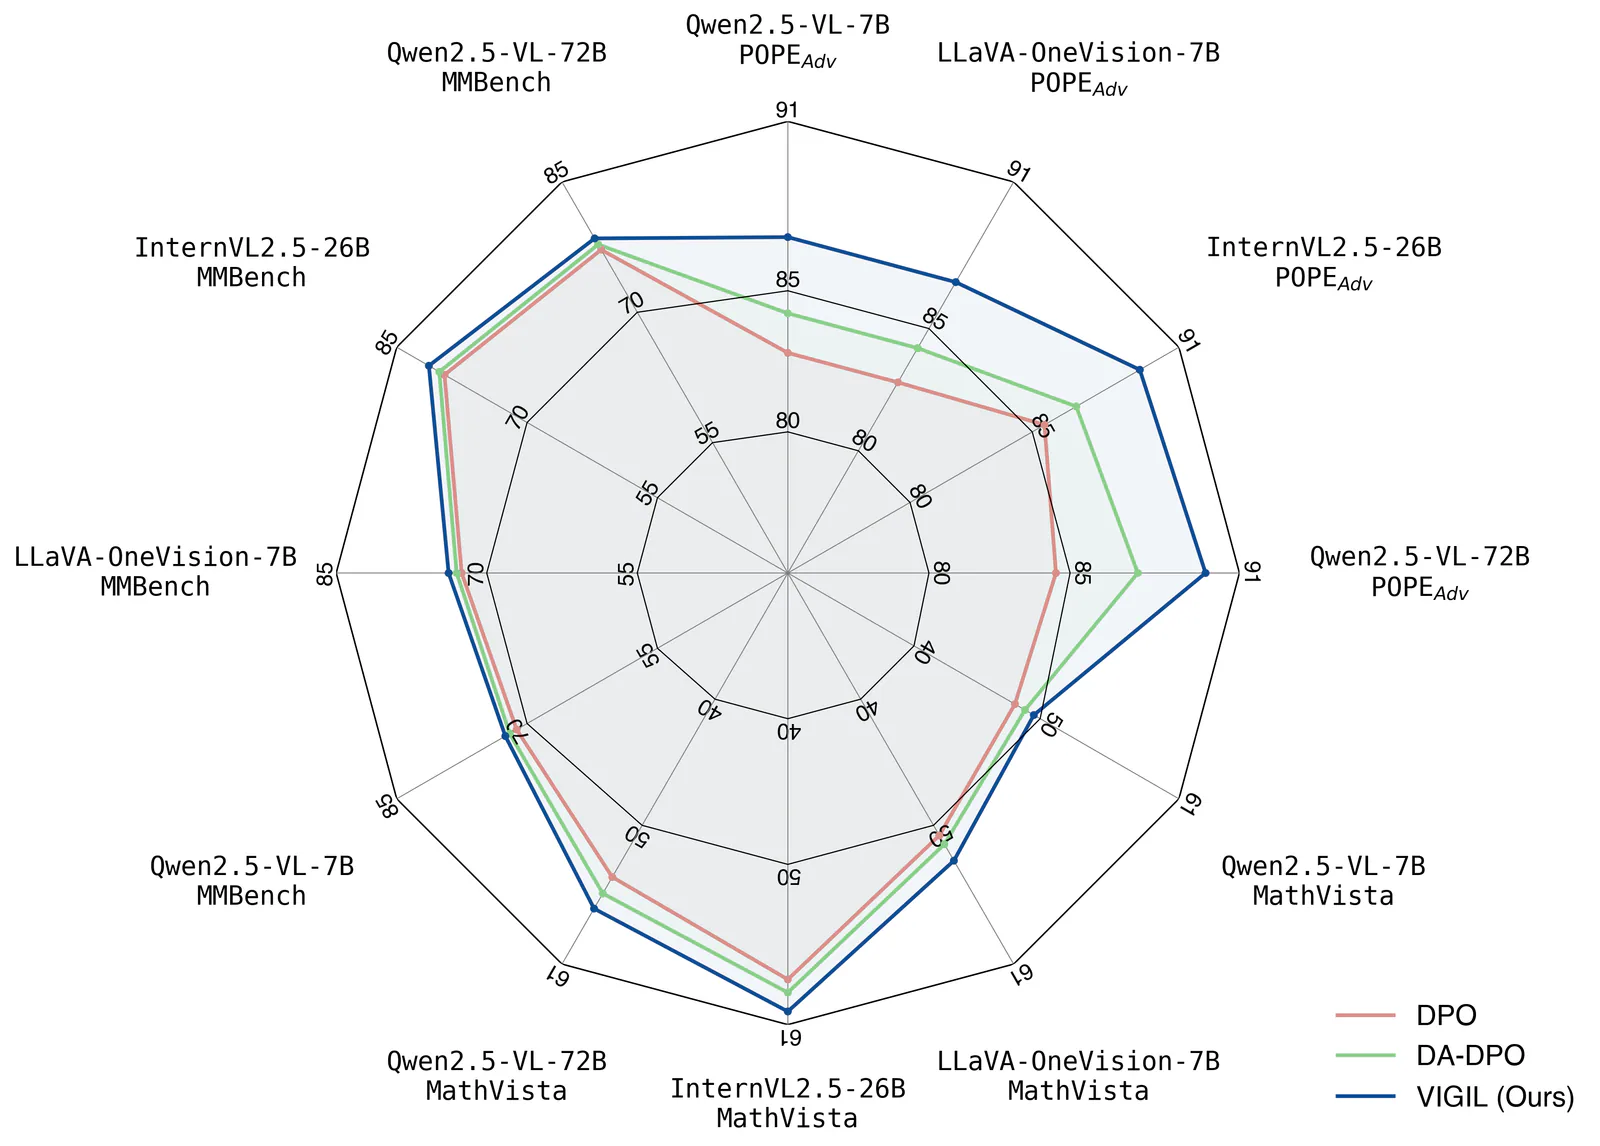
Create publication-style Matplotlib charts with an AI agent, using scientific plotting conventions, reference scripts and print or vector export guidance.

Create editorial diagrams in your brand with an AI agent. Supports architecture, flowcharts, data charts, and redraws from Mermaid, draw.io, and Excalidraw, with HTML, SVG, and PNG output.

Create scientific figures in Python or R, with multi-panel layout checks, editable outputs and optional AI schematic drafts.
Build consulting presentations from HTML slide parts with a design rulebook, automated checks, PDF output and an optional editable PowerPoint conversion.
Create Marp presentations from Markdown with SVG charts, dashboard components and reference decks, then export to HTML, PDF or PowerPoint.
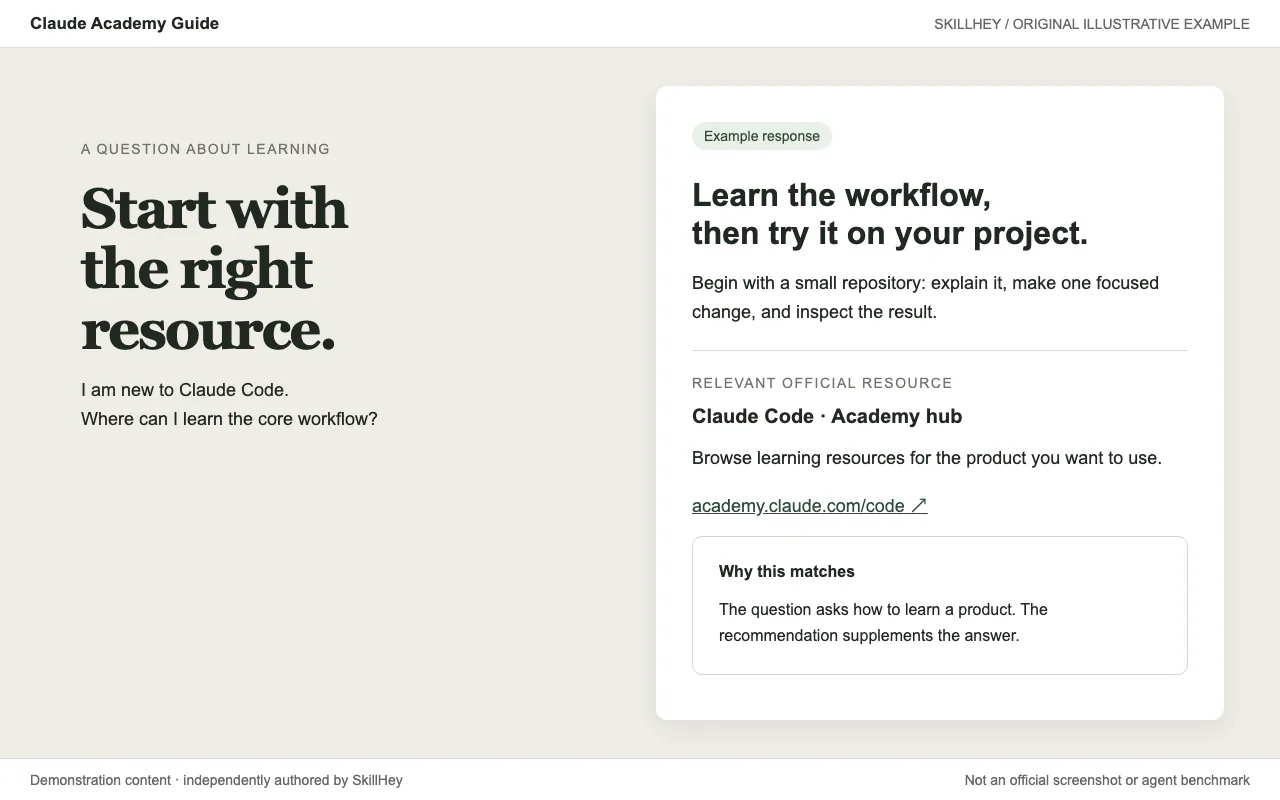
Create and edit PowerPoint decks with varied layouts, editable charts and document validation.
Map feature flows, identify repeated concerns, and propose a unified architecture with source-linked handoff prompts.
Read, create, or edit Excel spreadsheets (.xlsx/.xlsm) — sheet data, formulas, styles, charts, multi-sheet workbooks — and bulk .csv/.tsv tables; use whenever a spreadsheet is the input or the deliverable (extract/analyze data, add columns/formulas/formatting/charts, clean messy tables, build from scratch), but not for Google Sheets API or Word/PDF/script outputs.
Read, create, or edit PowerPoint .pptx decks — build slides from an outline, extract slide text/speaker notes, edit shapes/tables/charts, replace images, or export to PDF/images.
A small library, made with care. More skills are on the way.