Figures for Papers
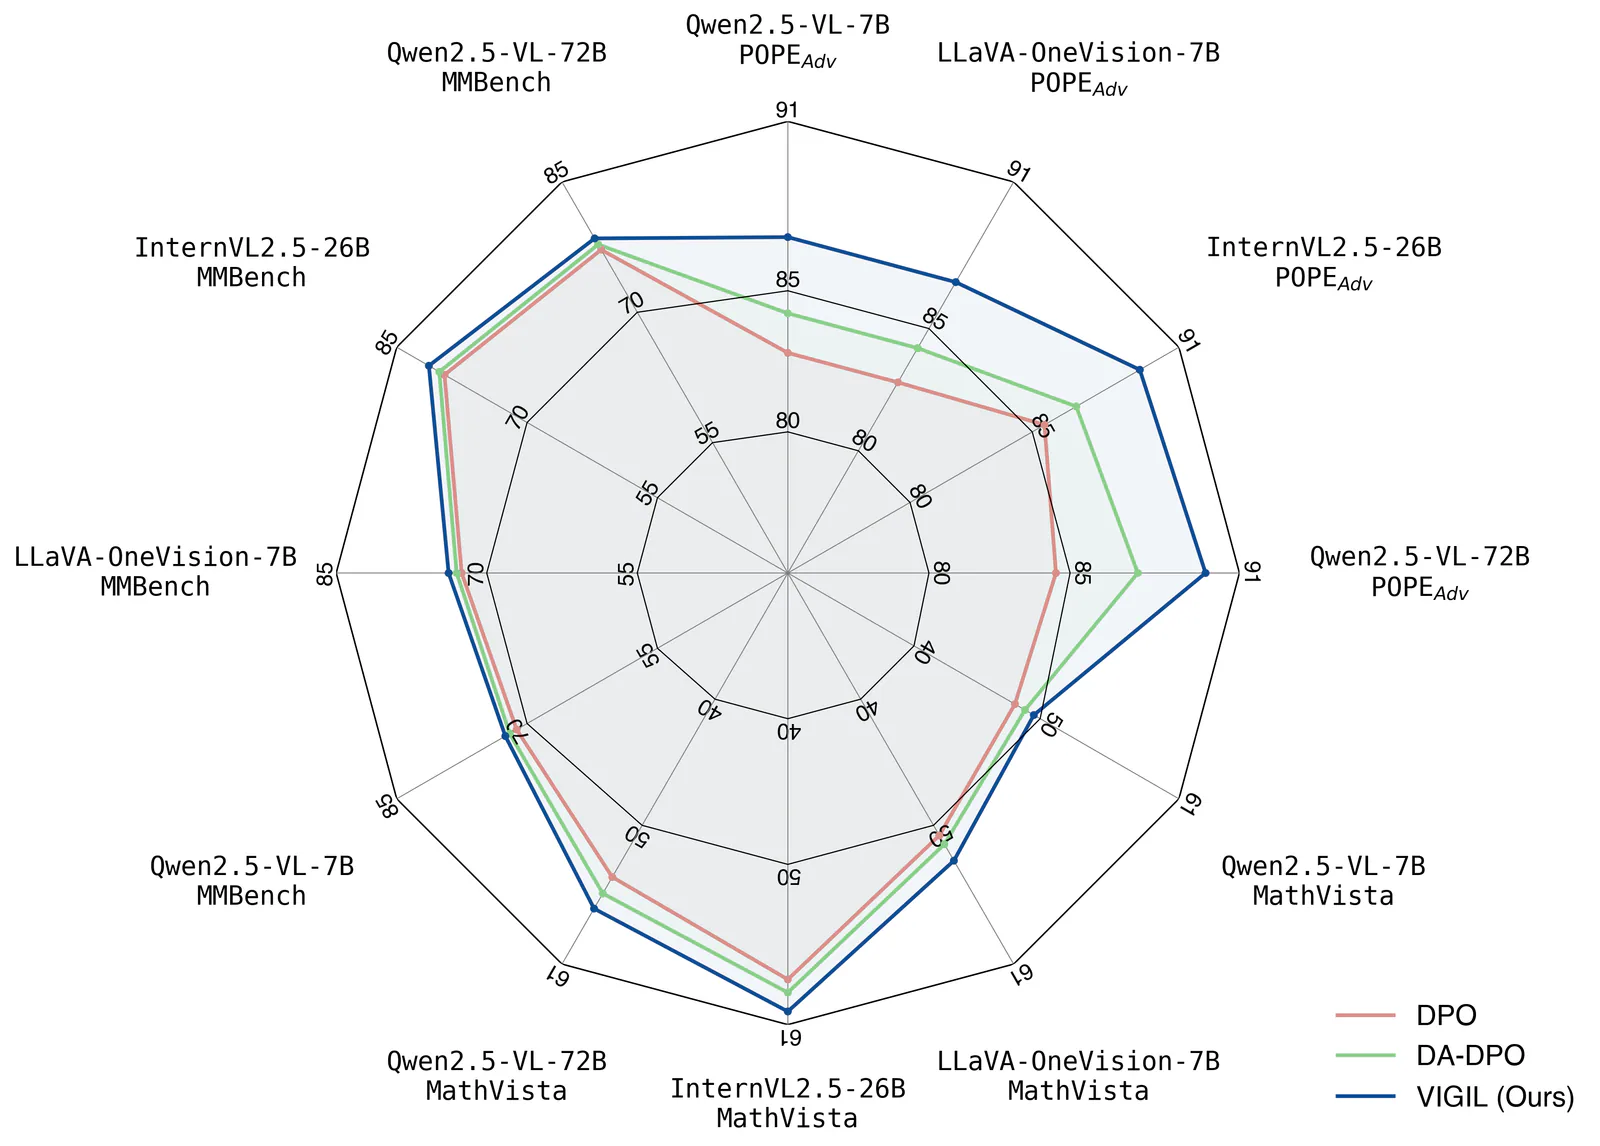
Create publication-style Matplotlib charts with an AI agent, using scientific plotting conventions, reference scripts and print or vector export guidance.
Original workflows for websites, images, presentations, and everything in motion.
Create publication-style Matplotlib charts with an AI agent, using scientific plotting conventions, reference scripts and print or vector export guidance.
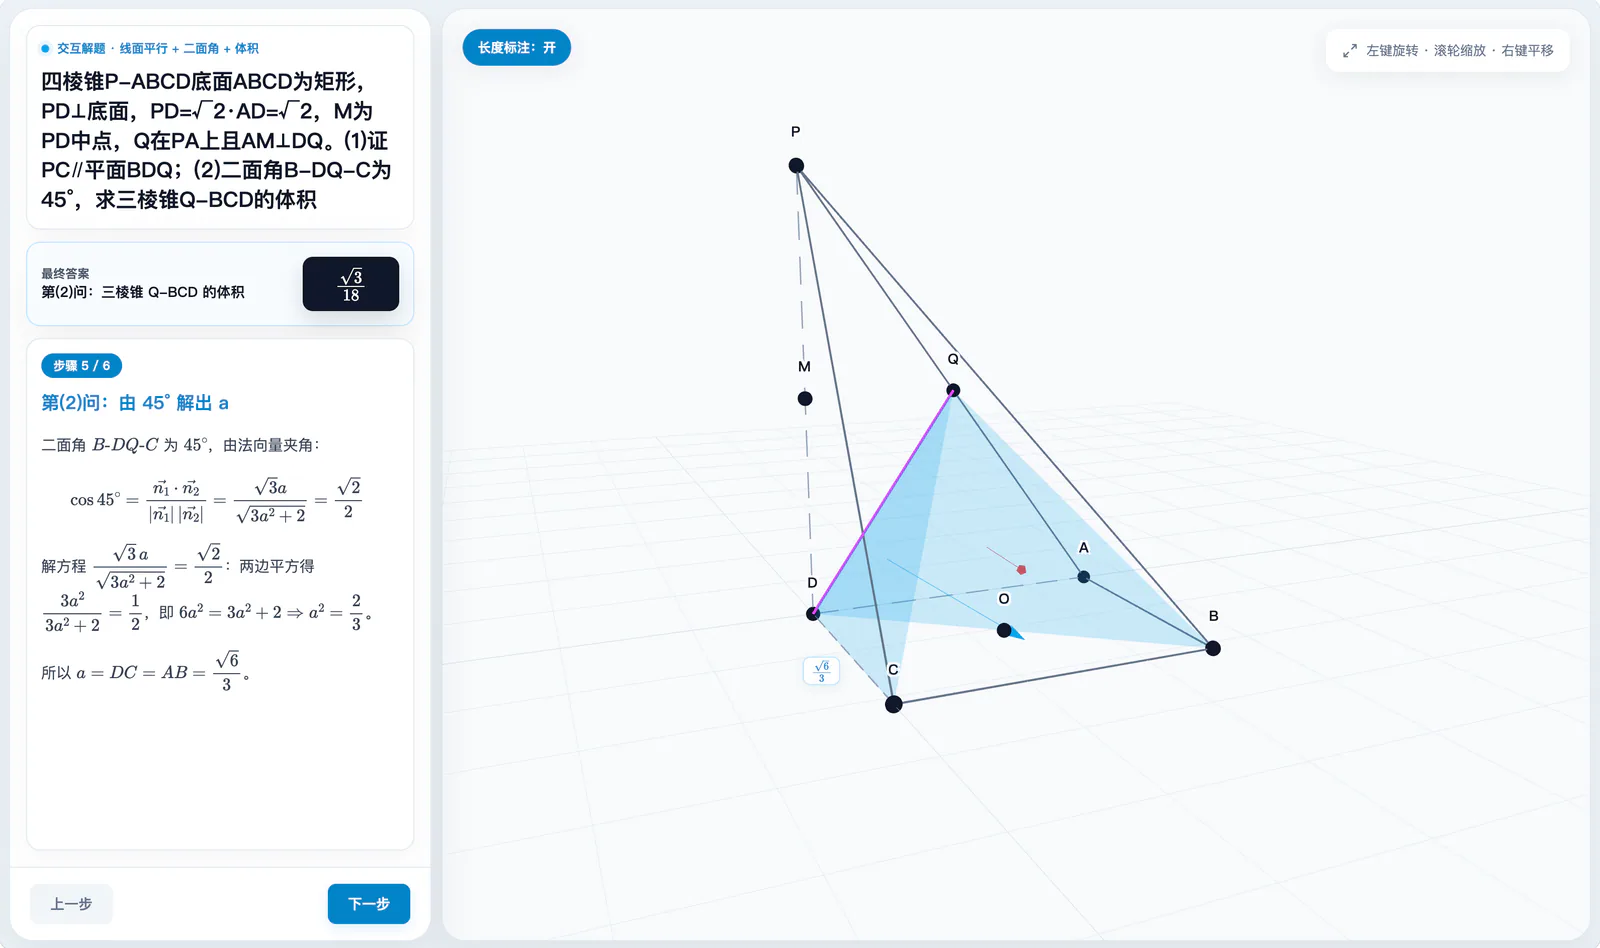
Create mathematical explanations and 3D animations in Python, inspect their layout and timing, and export MP4 videos with editable scene source.
Turn a reaction into a 3D molecular demonstration with balanced equations, bond changes, atom-conservation checks, and a reaction-progress slider.
Create scientific figures in Python or R, with multi-panel layout checks, editable outputs and optional AI schematic drafts.
Build WebGL map applications with interactive geographic layers, animations, and spatial datasets.
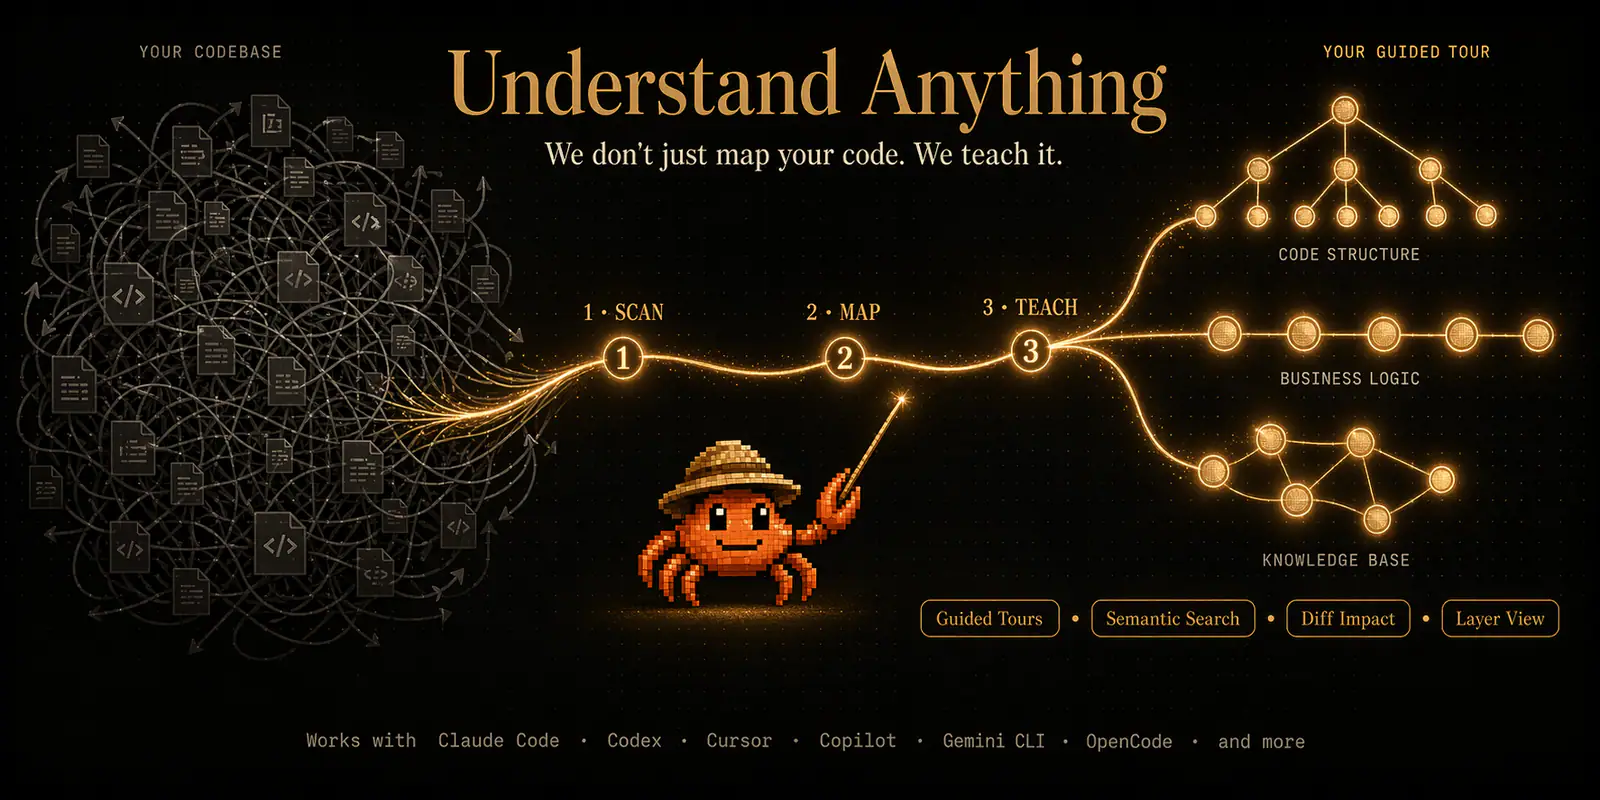
Launch an interactive dashboard for exploring a project’s saved knowledge graph.
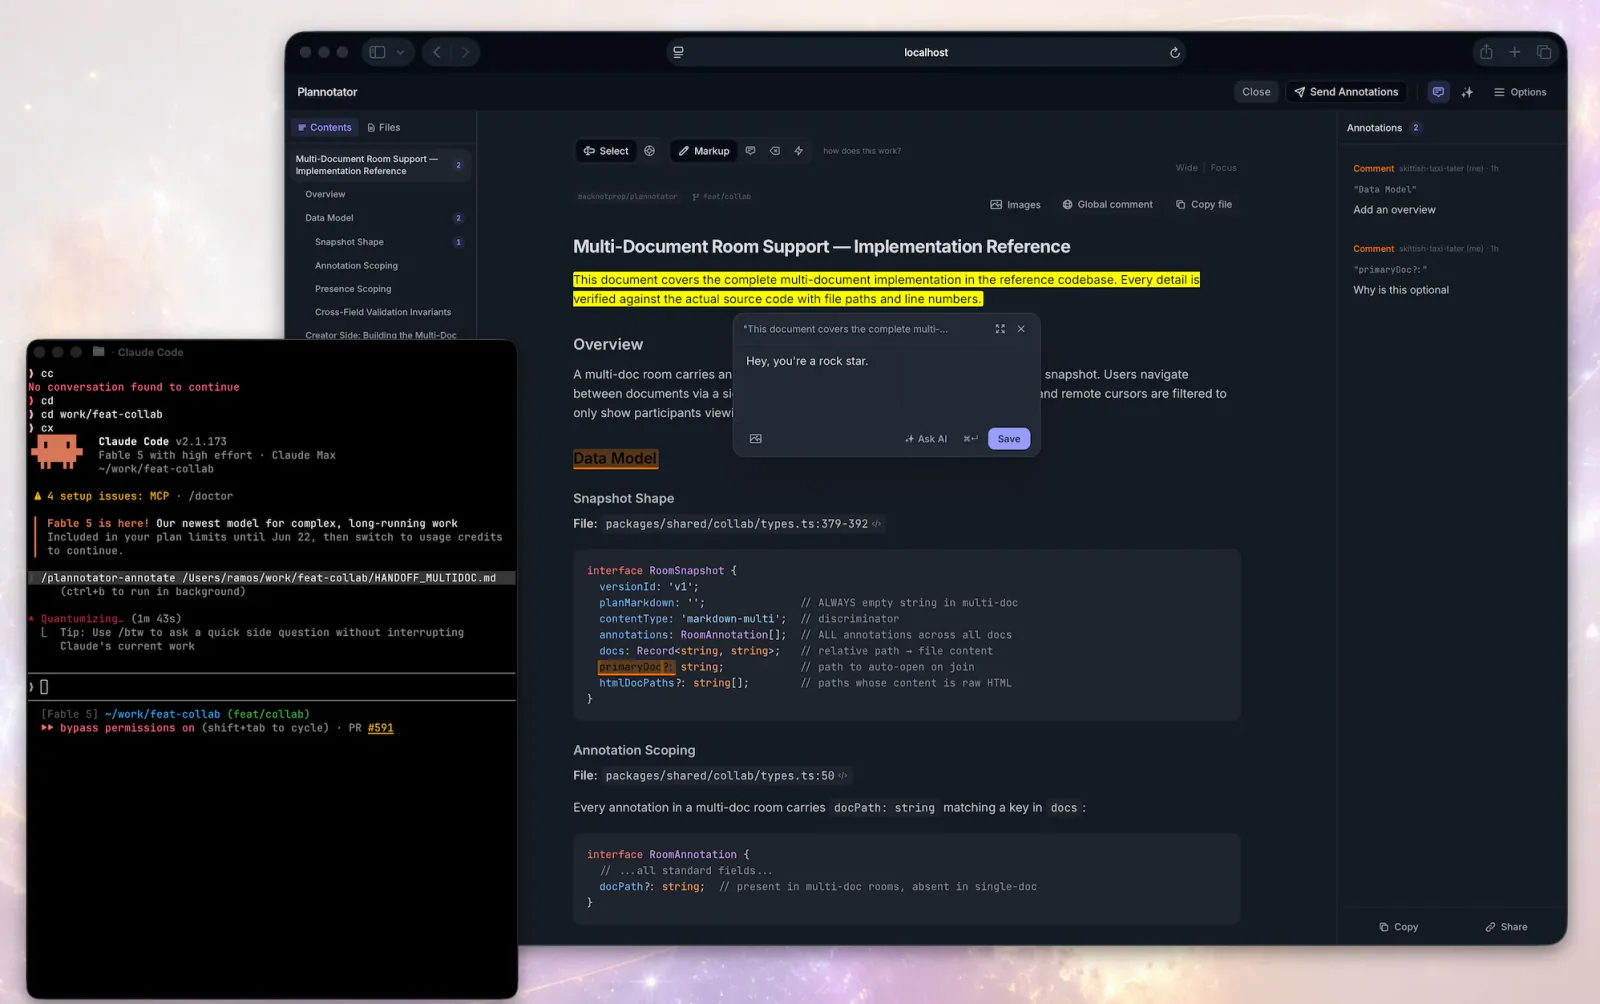
Generate self-contained HTML visualizations with Plannotator theming.
Create high-fidelity HTML prototypes, presentations, animations and visualizations with explicit design-direction review.
Create visual HTML articles, interfaces, images, motion videos and narrated web presentations, or retrieve local knowledge.
Build or redesign polished browser-rendered visual artifacts with HTML/CSS/JavaScript/React: pages, dashboards, prototypes, slide decks, animations, UI mockups, and data visualizations.
A small library, made with care. More skills are on the way.