Data Analysis Skills for AI Agents: Spreadsheets, Statistics and Charts
Last updated: 2026-11-10
Choose a Skill for the stage of analysis you need. Excel Spreadsheets focuses on workbook creation and editing; Marimo Notebook Pair works with a live Python notebook; Nature Statistics reviews statistical reporting; and Figures for Papers helps create publication-oriented Matplotlib figures. Experiment planning and an alternative scientific-figure workflow round out this guide.
The descriptions below draw on published instructions and catalog documentation, not a benchmark or a claim that these tools were run for this article. A useful analysis still needs appropriate data, reproducible calculations and a reviewer who understands the subject.
Match the Skill to the task
Excel Spreadsheets
Create and edit spreadsheets with explicit assumptions, consistent formulas, formatting and recalculation checks.
193,4 milEstrelasgit clone https://github.com/anthropics/skills.git anthropic-skills
mkdir -p .claude/skills
cp -R anthropic-skills/skills/xlsx .claude/skills/Installation options
/plugin marketplace add anthropics/skills/plugin install document-skills@anthropic-agent-skills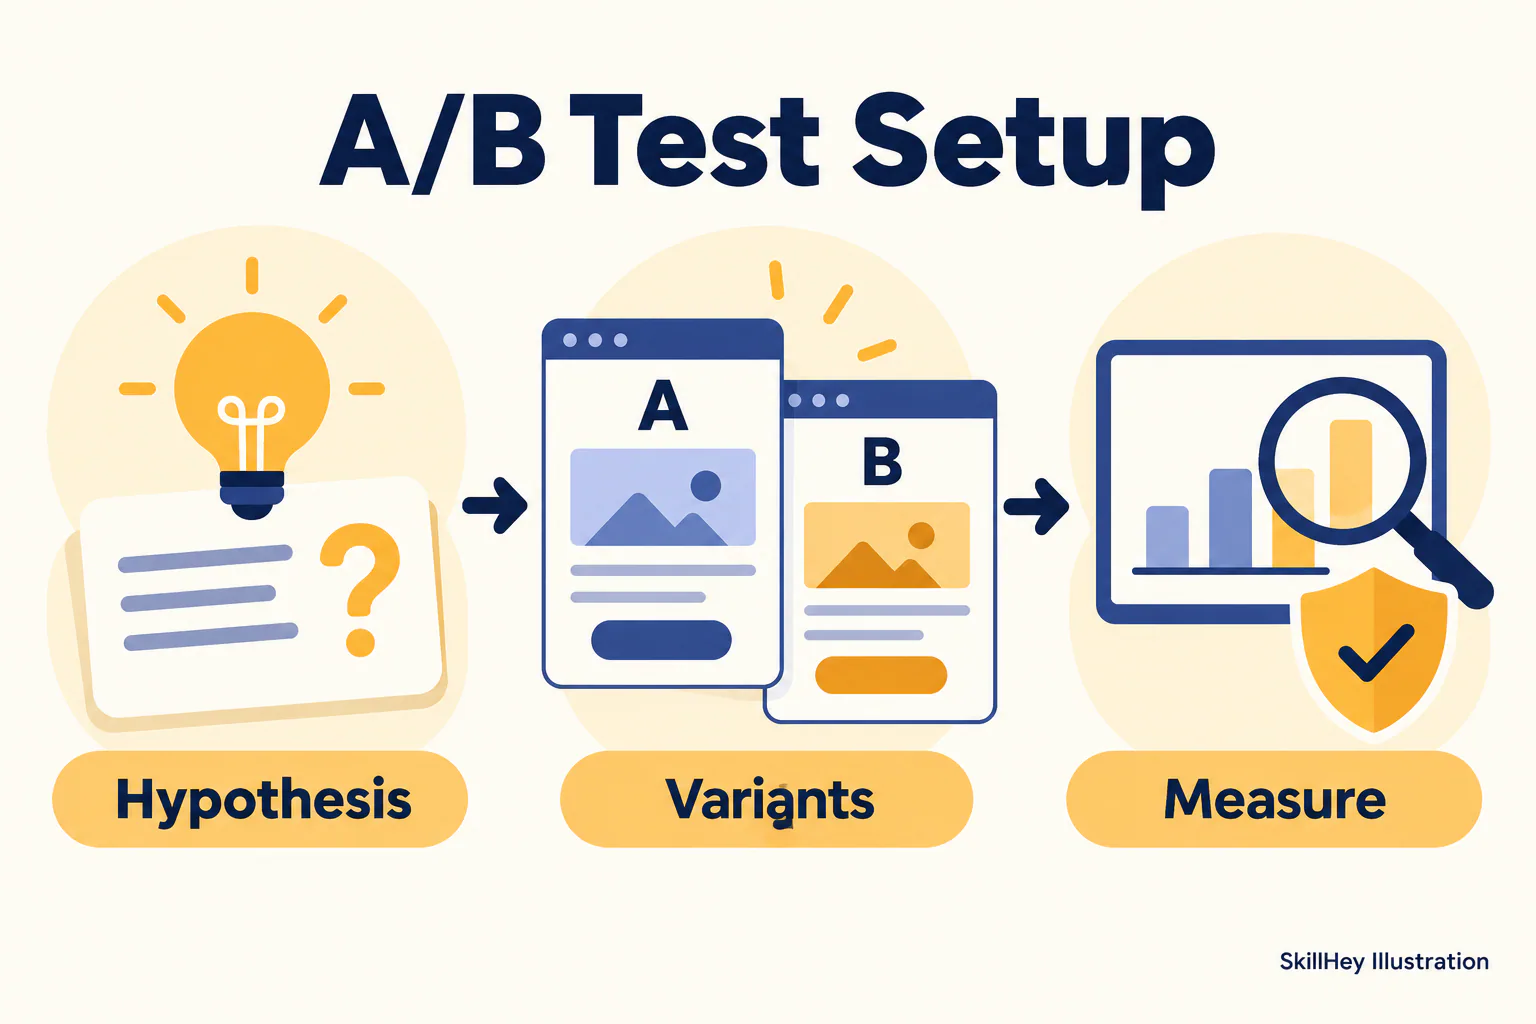
A/B Test Setup
Plan hypotheses, variants, sample size and guardrail metrics for growth experiments.
59,9 milEstrelasnpx skills add coreyhaines31/marketingskills --skill ab-testingInstallation options
npx skills add coreyhaines31/marketingskills --skill product-marketing ab-testing -a claude-codenpx skills add coreyhaines31/marketingskills --list
Nature Statistics
Audit statistical reporting across methods, results and figure legends, including replication, uncertainty and multiple comparisons.
53,3 milEstrelasnpx skills add Yuan1z0825/nature-skills --agent codex --skill nature-statistics --skill nature-shared --yes --copyInstallation options
npx skills add Yuan1z0825/nature-skills --agent claude-code --skill nature-statistics --skill nature-shared --yes --copy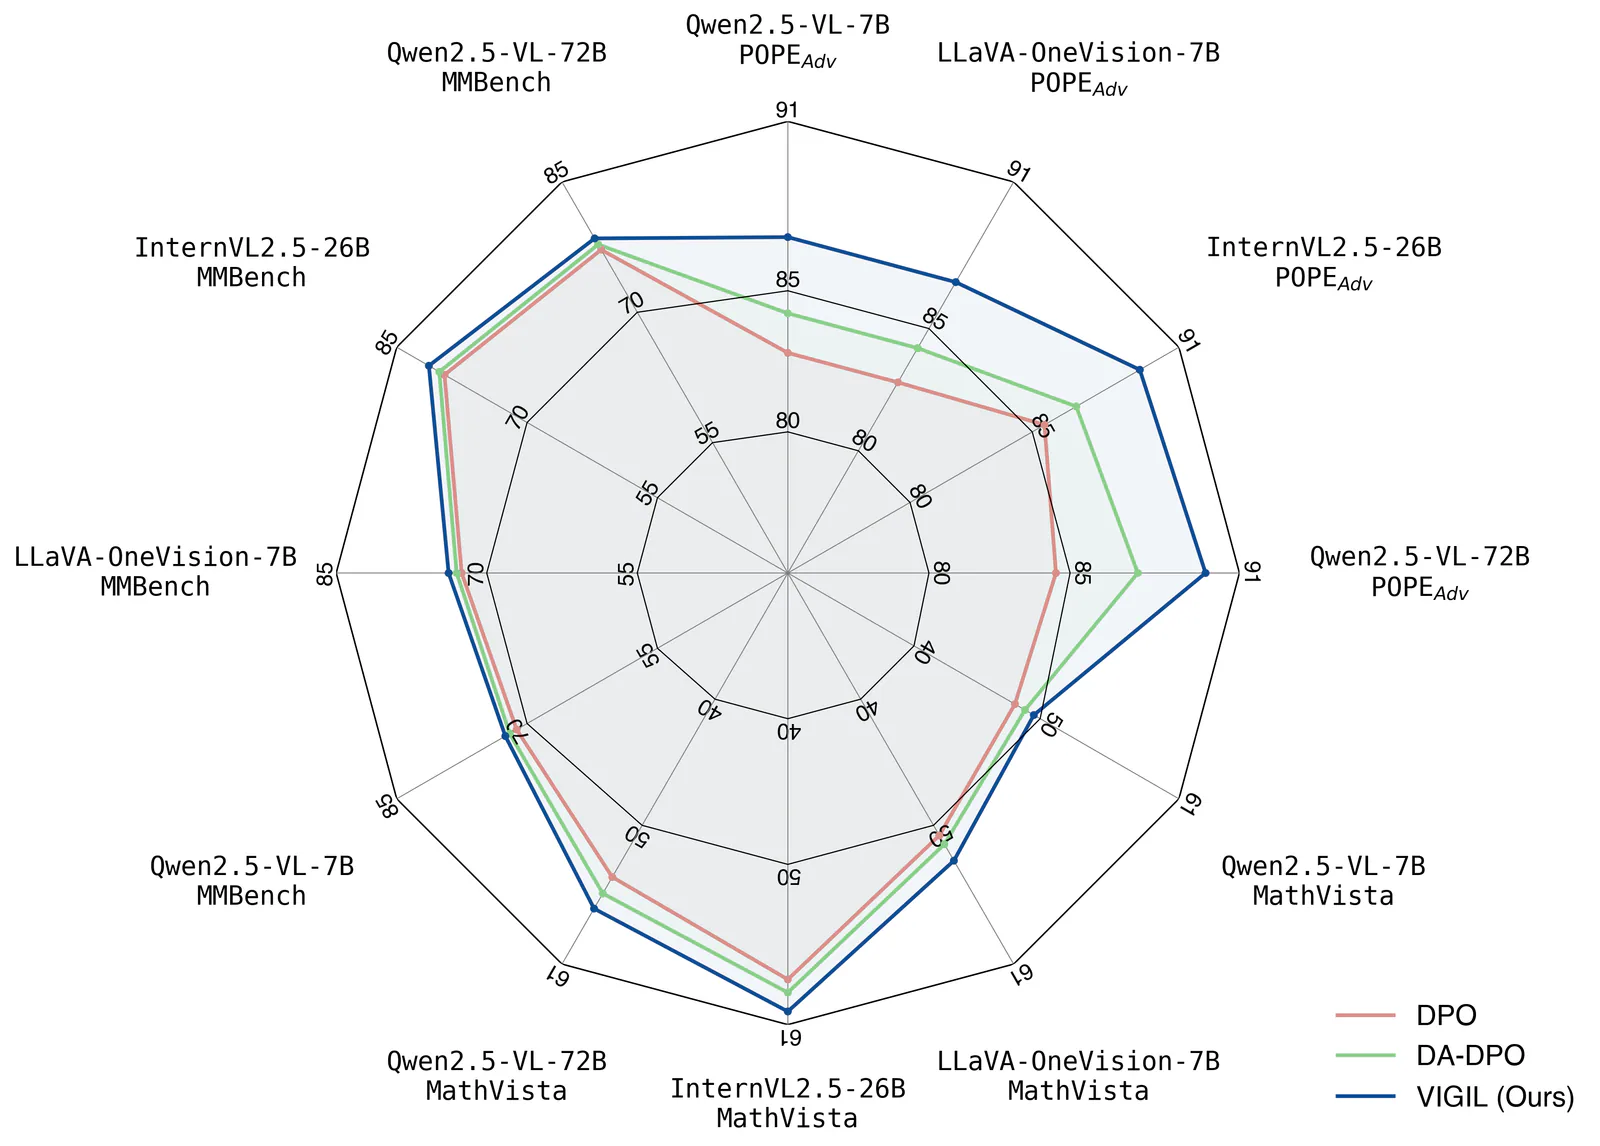
Figures for Papers
Create publication-style Matplotlib charts with an AI agent, using scientific plotting conventions, reference scripts and print or vector export guidance.
11,1 milEstrelasgit clone https://github.com/ChenLiu-1996/figures4papers.gitInstallation options
Clone the repository and open it in your AI coding agent. You can use the Skill directly by pointing the agent to scientific-figure-making/SKILL.md and its references.
git clone https://github.com/ChenLiu-1996/figures4papers.git
cd figures4papersmkdir -p .claude/skills
ln -s "$PWD/scientific-figure-making" .claude/skills/scientific-figure-makingmkdir -p .agents/skills
ln -s "$PWD/scientific-figure-making" .agents/skills/scientific-figure-makingmkdir -p .cursor/skills
ln -s "$PWD/scientific-figure-making" .cursor/skills/scientific-figure-makingNature Figure
Create scientific figures in Python or R, with multi-panel layout checks, editable outputs and optional AI schematic drafts.
53,3 milEstrelasnpx skills add Yuan1z0825/nature-skills --agent codex --skill nature-figure --skill nature-shared --yes --copyInstallation options
npx skills add Yuan1z0825/nature-skills --agent claude-code --skill nature-figure --skill nature-shared --yes --copyAgent support
Declared by the skill author
| Skill | Agent support |
|---|---|
| Excel Spreadsheets | Claude Code |
| Marimo Notebook Pair | Not specified |
| A/B Test Setup | Claude Code, Codex CLI, Cursor, GitHub Copilot, DeepSeek Harness, Gemini CLI, Grok Build, Hermes Agent, OpenCode, Pi, Kiro, Rovo Dev, Qoder, Mistral Vibe, Google Antigravity |
| Nature Statistics | Claude Code, Codex CLI, Hermes Agent, OpenCode |
| Figures for Papers | Claude Code, Codex CLI, Cursor |
| Nature Figure | Claude Code, Codex CLI, Hermes Agent, OpenCode |
A full list is a declaration, not a test.
| Task | Skill | Main output |
|---|---|---|
| Build or revise a workbook | Excel Spreadsheets | A spreadsheet with formulas and checks |
| Work in a live Python notebook | Marimo Notebook Pair | Notebook changes in a running environment |
| Design a growth experiment | A/B Test Setup | Hypothesis, variants and measurement plan |
| Inspect reported statistics | Nature Statistics | A review of statistical reporting |
| Produce Matplotlib figures | Figures for Papers | Publication-oriented chart scripts and exports |
| Make multi-panel research figures | Nature Figure | Scientific figures in Python or R |
Prepare a workbook that can be checked
Excel Spreadsheets covers creating and editing spreadsheets with explicit assumptions, formulas, formatting and recalculation checks. Its upstream instructions describe how to handle spreadsheet work and required tooling. Supply the original file, a data dictionary and the questions the workbook needs to answer. Identify input cells, derived values and units, and keep a copy of the original.
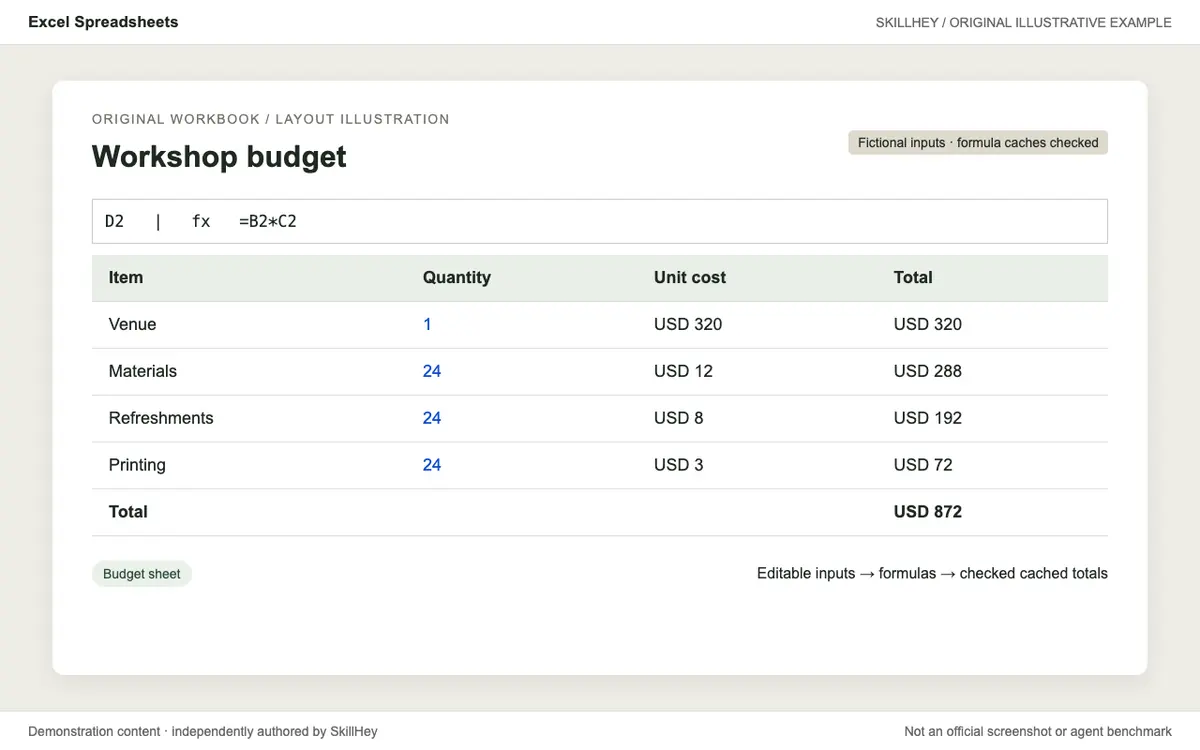
Ask for formulas and a reconciliation against source totals, not just a formatted workbook. Check how missing values, duplicate rows and currency or date formats are handled. Recalculation requires a compatible tool; opening a file with stale cached formula values is not evidence that its calculations were checked.
Keep exploratory analysis reproducible
Marimo Notebook Pair is intended for work in a live marimo notebook kernel and persisting Python notebook changes. Review its source instructions and available environment before using it. It assumes an appropriate marimo setup; a Skill alone does not provide your data, packages or a running kernel.
Give the agent a small, representative dataset and a question. Ask it to document the dataset version, transformations, exclusions and assumptions next to the analysis. Review unexpected values before making a chart. A notebook is reproducible only if someone else can obtain the inputs and run the relevant steps with the required environment.
Plan comparisons and inspect the reporting
A/B Test Setup is a growth-experiment planning workflow for hypotheses, variants, sample size and guardrail metrics. The upstream entry can help organize a proposal. Define the unit of assignment, primary outcome, eligible population and decision rule in advance. Check sample-size assumptions with the appropriate statistical expertise and measurement data; a suggested number is not a guarantee of a conclusive test.
Nature Statistics focuses on auditing statistical reporting across methods, results and figure legends, including replication, uncertainty and multiple comparisons. Its instructions belong to Nature Skills, whose index labels the workflow Draft. Preserve the required shared components and review the output against the underlying study. A reporting audit is distinct from validating the analysis or deciding that a statistical method is appropriate.
Choose a chart workflow for the destination
Figures for Papers provides Matplotlib guidance, reference scripts and export conventions for publication-oriented charts. The author's repository includes concrete figure examples. Give it the underlying data, intended figure dimensions and required formats, then check labels, units, uncertainty and visual readability. Its repository uses CC BY-NC 4.0; check the license and obtain permission for uses outside its terms. It is focused on Matplotlib rather than interactive dashboards.
Nature Figure offers a separate Python or R workflow for scientific figures and multi-panel layouts. Its upstream task has shared dependencies; retain them when installing. Select it when that workflow fits the desired output, and verify the resulting chart against the actual data and analysis.
A data brief to reuse
Question and audience: [decision and reader]
Data: [files, source, collection period, units and permissions]
Methods: [known definitions, assumptions and exclusions]
Deliver: [workbook or notebook, checks, chart and short explanation]
Review: [reconcile totals, inspect missing values, label uncertainty]
Ask for a separate list of unresolved data issues. A clear chart should make the underlying measure and its limitations easier to inspect. For further literature or source work, see the research guide; for other workflows, browse the Data Analysis topic.