Figures for Papers
Create publication-style Matplotlib charts with an AI agent, using scientific plotting conventions, reference scripts and print or vector export guidance.
Explore workflows for turning datasets into analysis, charts, and readable findings.
27 skillsCreate publication-style Matplotlib charts with an AI agent, using scientific plotting conventions, reference scripts and print or vector export guidance.
Create and edit spreadsheets with explicit assumptions, consistent formulas, formatting and recalculation checks.
Design tracking plans, event names, conversion definitions and validation checks.
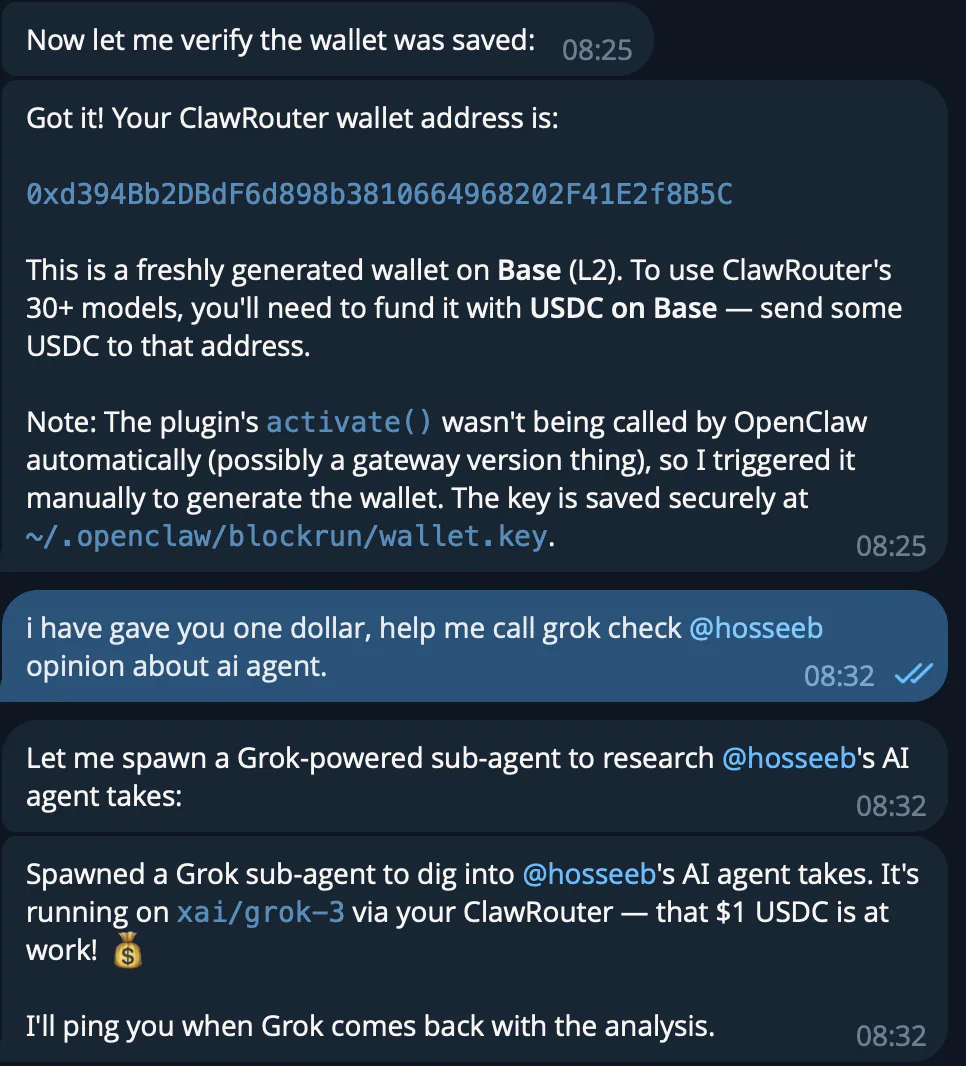
Access Surf market, on-chain, news and project data through ClawRouter.
Create publication-style Matplotlib charts with an AI agent, using scientific plotting conventions, reference scripts and print or vector export guidance.
Create and edit spreadsheets with explicit assumptions, consistent formulas, formatting and recalculation checks.
Design tracking plans, event names, conversion definitions and validation checks.
Access Surf market, on-chain, news and project data through ClawRouter.
Query prediction markets, cross-venue odds and wallet analytics through ClawRouter.
Create animated and explorable diagrams from compact JSON specifications, with scripted layout, styling, motion, and export workflows.
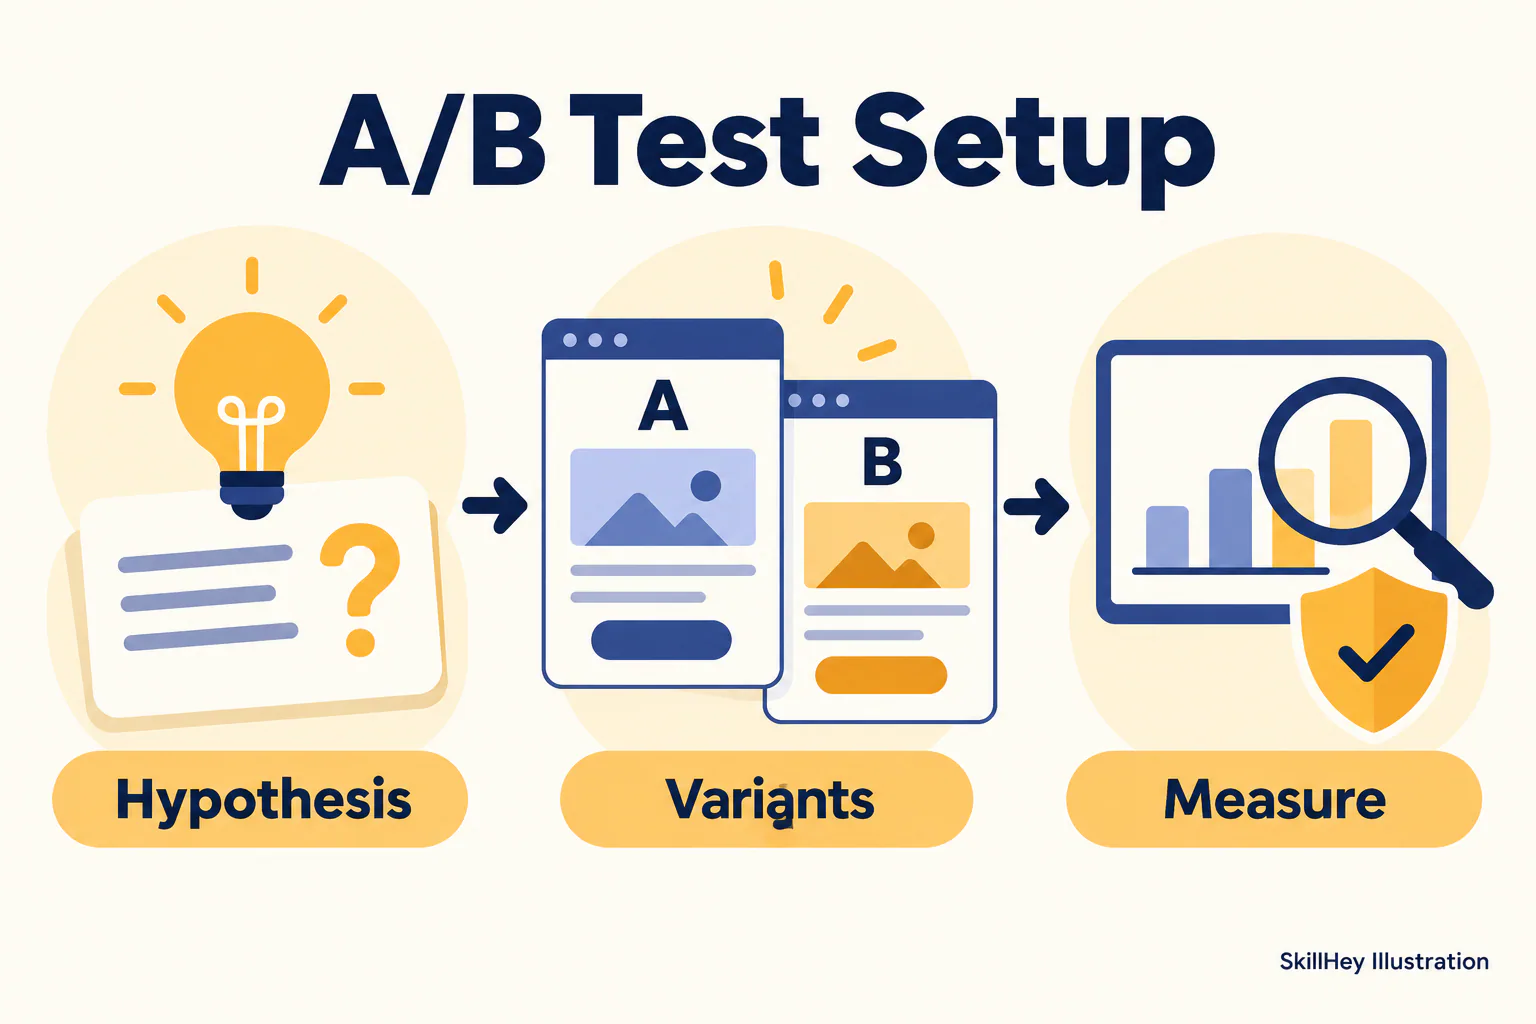
Plan hypotheses, variants, sample size and guardrail metrics for growth experiments.
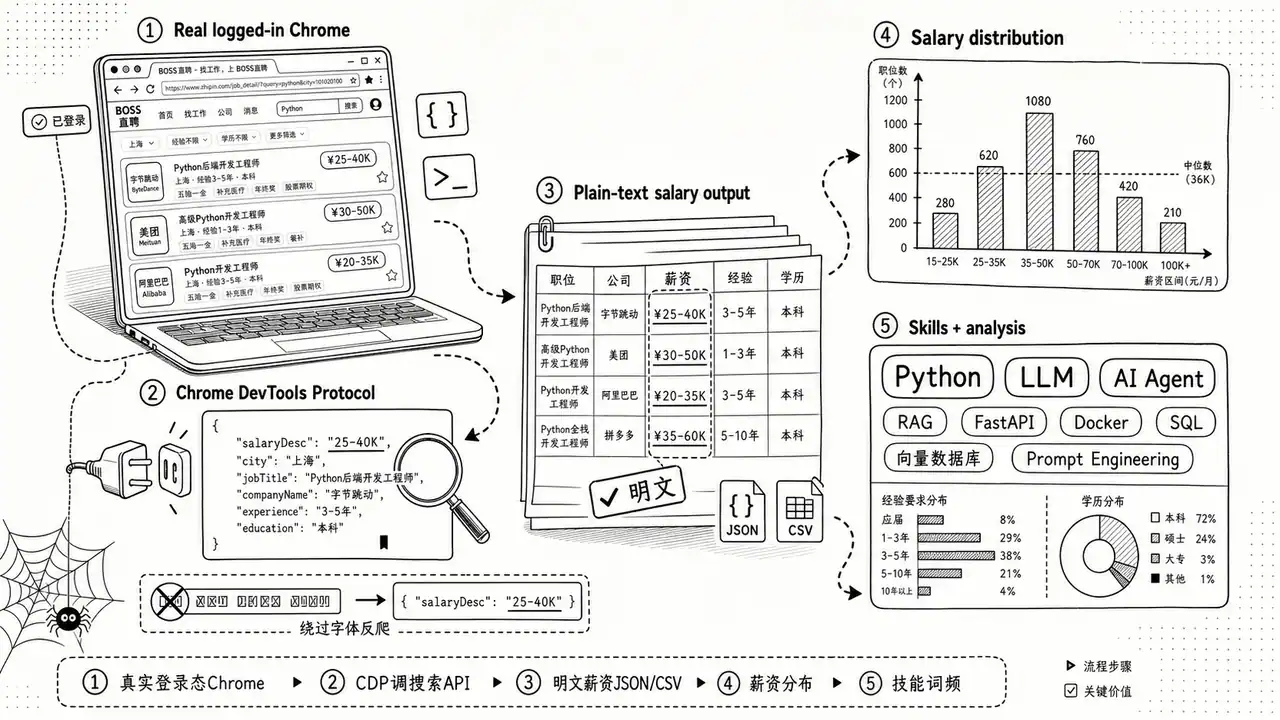
Collect job listings and descriptions from BOSS Zhipin through Chrome CDP and organize the results as JSON, CSV, or a job research report.
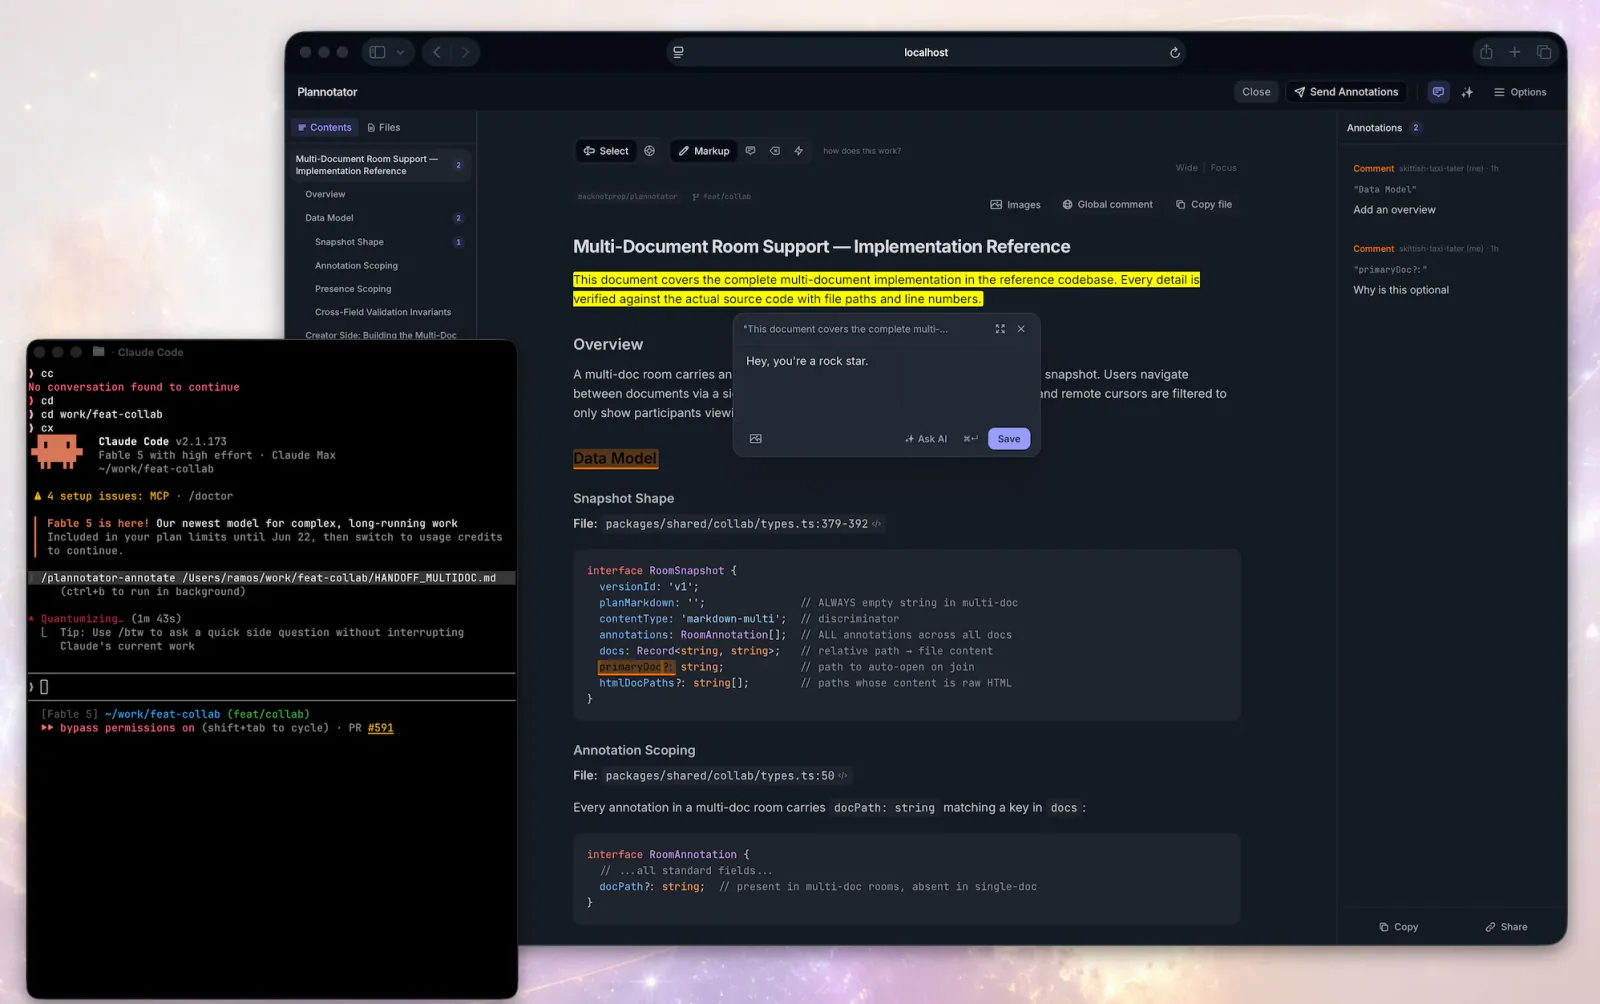
Analyze a user's Plannotator plan archive to extract denial patterns, feedback taxonomy, evolution over time, and actionable prompt improvements — then produce a polished HTML dashboard report. Falls back to Claude Code ExitPlanMode denial reasons when Plannotator data is unavailable.
Attach a factual employer sponsorship signal from configured data to US-role evaluations.
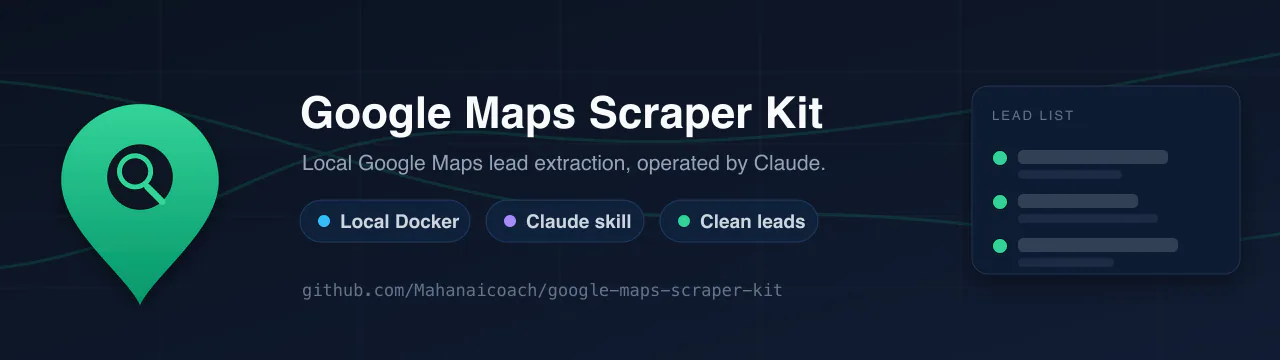
Run the local Google Maps scraper to collect business listings, reviews, and available contact details.
Create scientific figures in Python or R, with multi-panel layout checks, editable outputs and optional AI schematic drafts.
Compare attribution approaches, reconcile data sources and plan first-party conversion attribution.
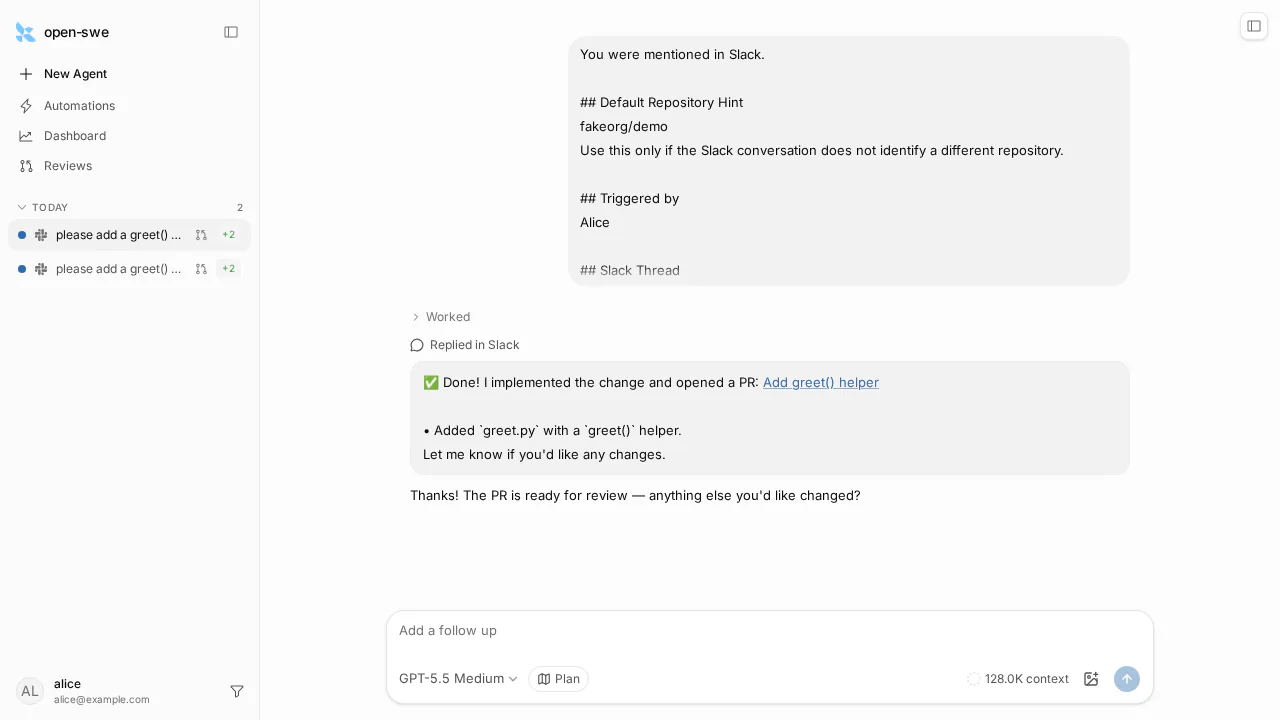
Build themed HTML plan artifacts, dashboard iframes and Slack attachments for the Open SWE runtime.
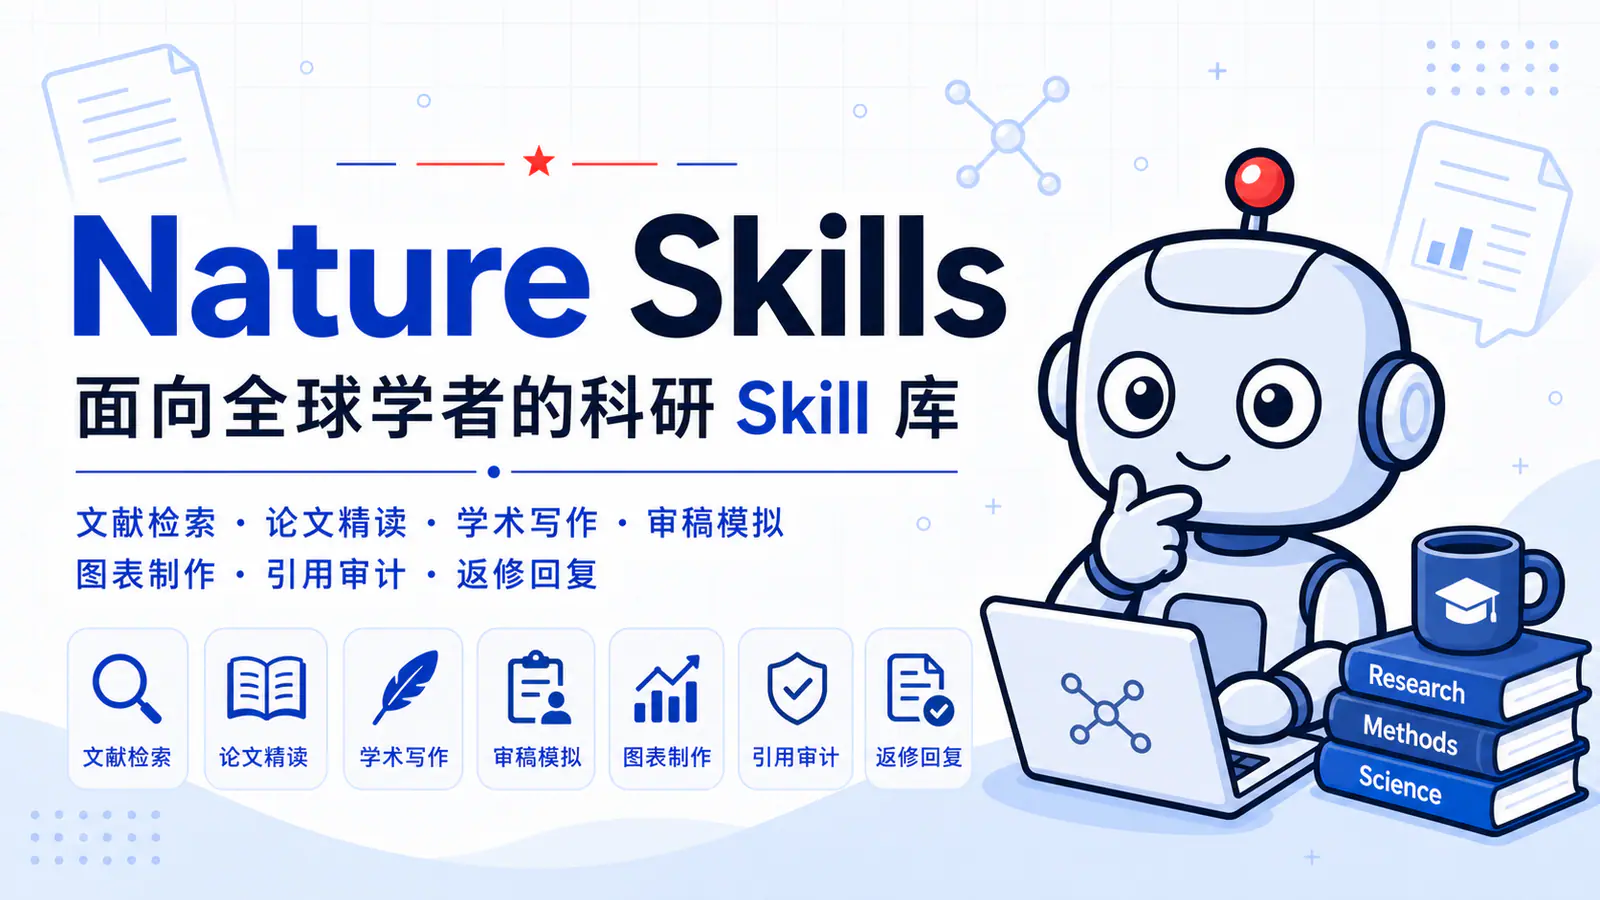
Audit statistical reporting across methods, results and figure legends, including replication, uncertainty and multiple comparisons.
Work in a live marimo notebook kernel and persist reproducible Python notebook changes.
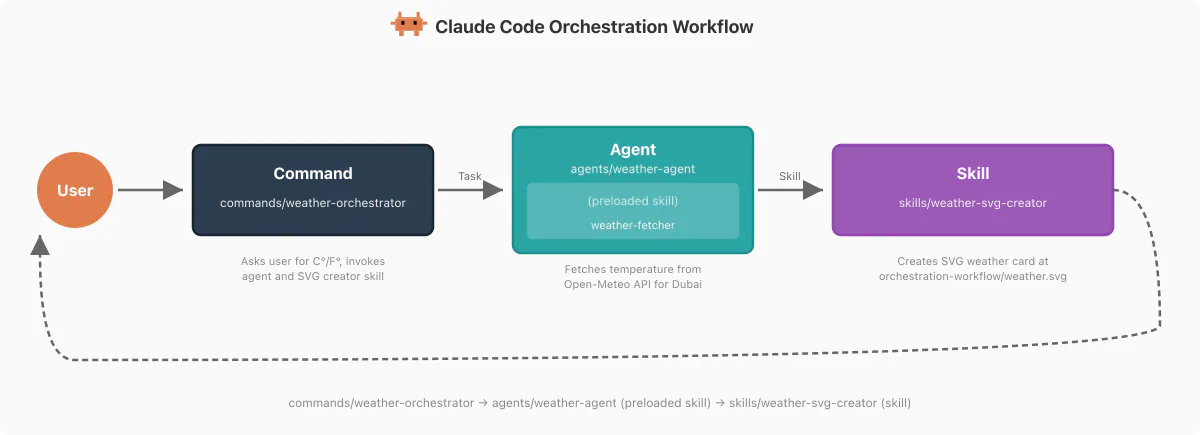
Fetch current Dubai temperature data from the example’s Open-Meteo endpoint.
Turn a business category and location into a structured CSV of local businesses using a locally hosted Google Maps scraping engine.
Build WebGL map applications with interactive geographic layers, animations, and spatial datasets.
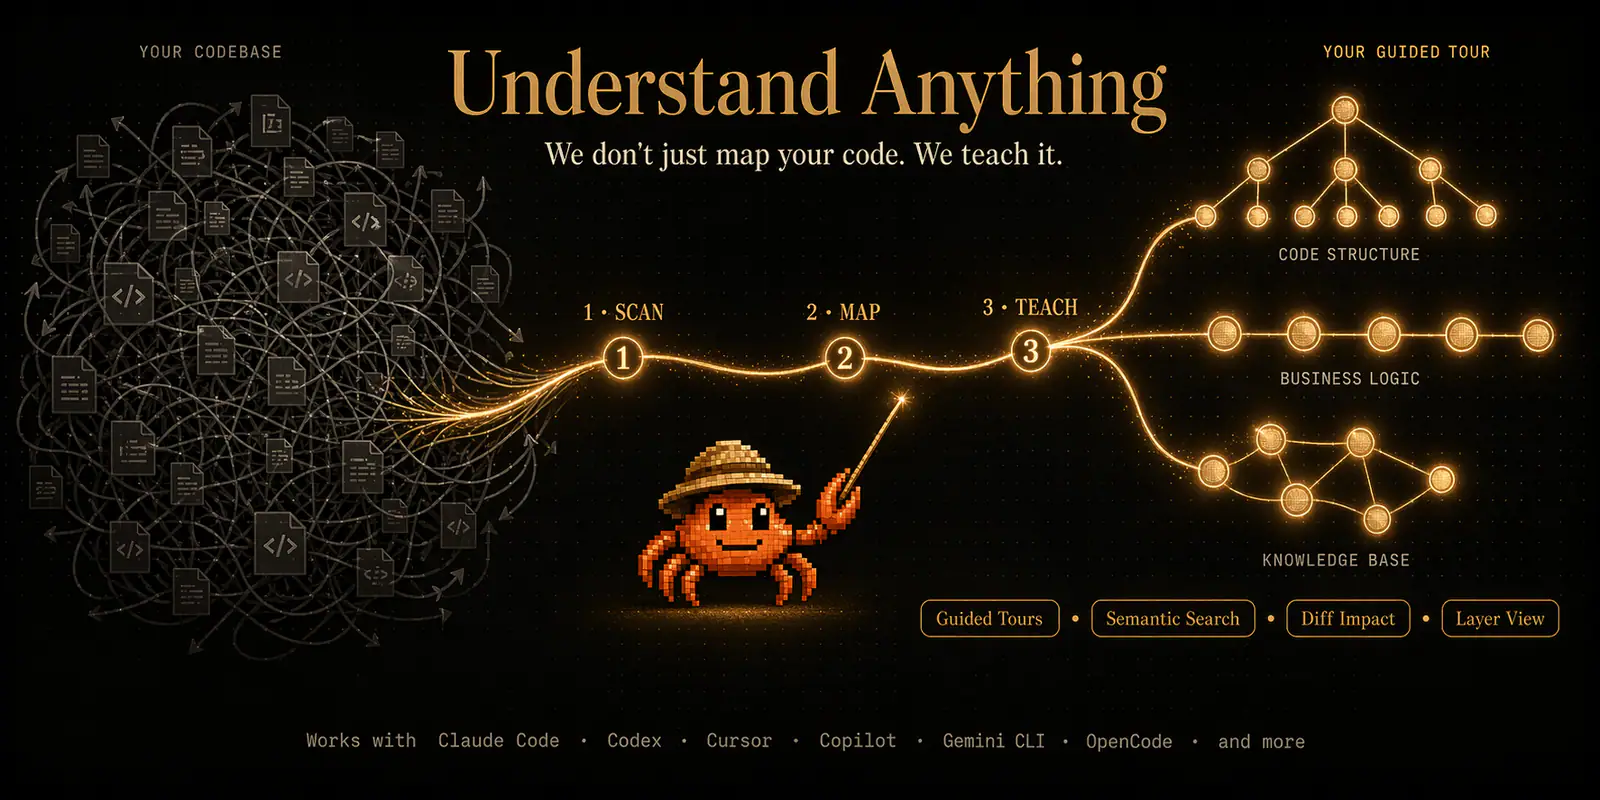
Launch an interactive dashboard for exploring a project’s saved knowledge graph.
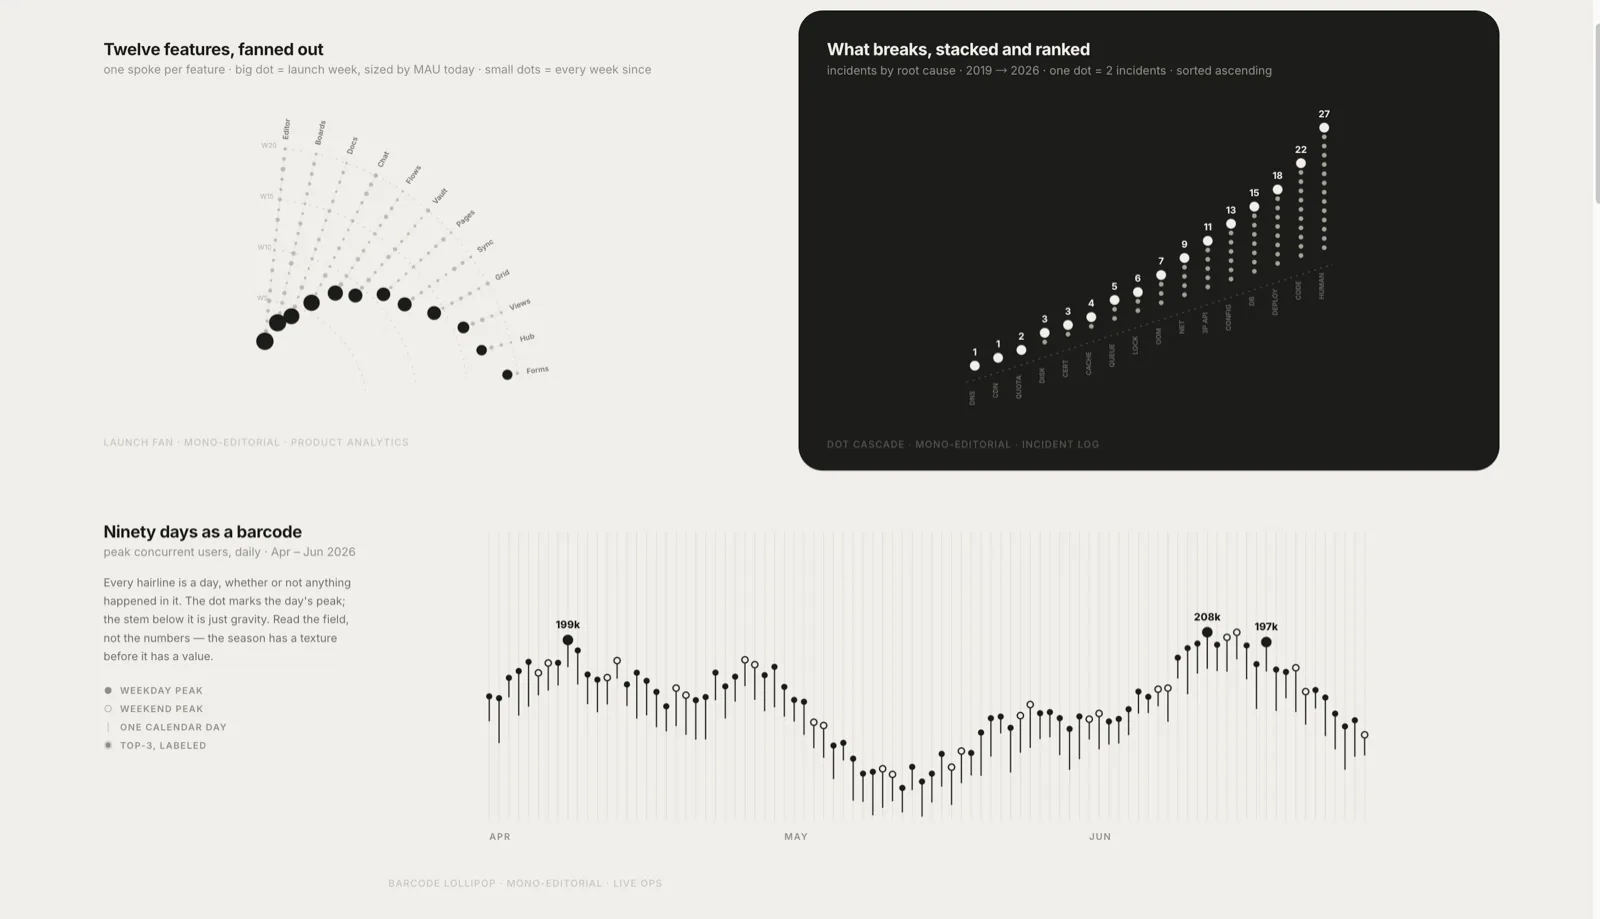
Create template-driven HTML data visualizations, full-page reports, and HTML or PDF presentations with consistent typography and chart styles.
Use an Apify actor as a configured job-source provider in the CareerOps pipeline.
Extract clean Markdown from HTML pages with Defuddle CLI.
Forecast univariate time series with Google TimesFM, including uncertainty estimates and optional covariates.
Summarize or extract text/transcripts from URLs, podcasts, and local files (great fallback for “transcribe this YouTube/video”).
Use when the user needs to query, filter, reshape, extract, create, or construct JSON data — including API responses, config files, log output, or any structured data — or when helping the user write or debug JSON transformations.
Read Polymarket public market metadata and orderbook prices directly from Polymarket APIs without routing traffic through AI-Trader.
Explore workflows for turning datasets into analysis, charts, and readable findings.