Explore Data Analysis skills 6 skills Images
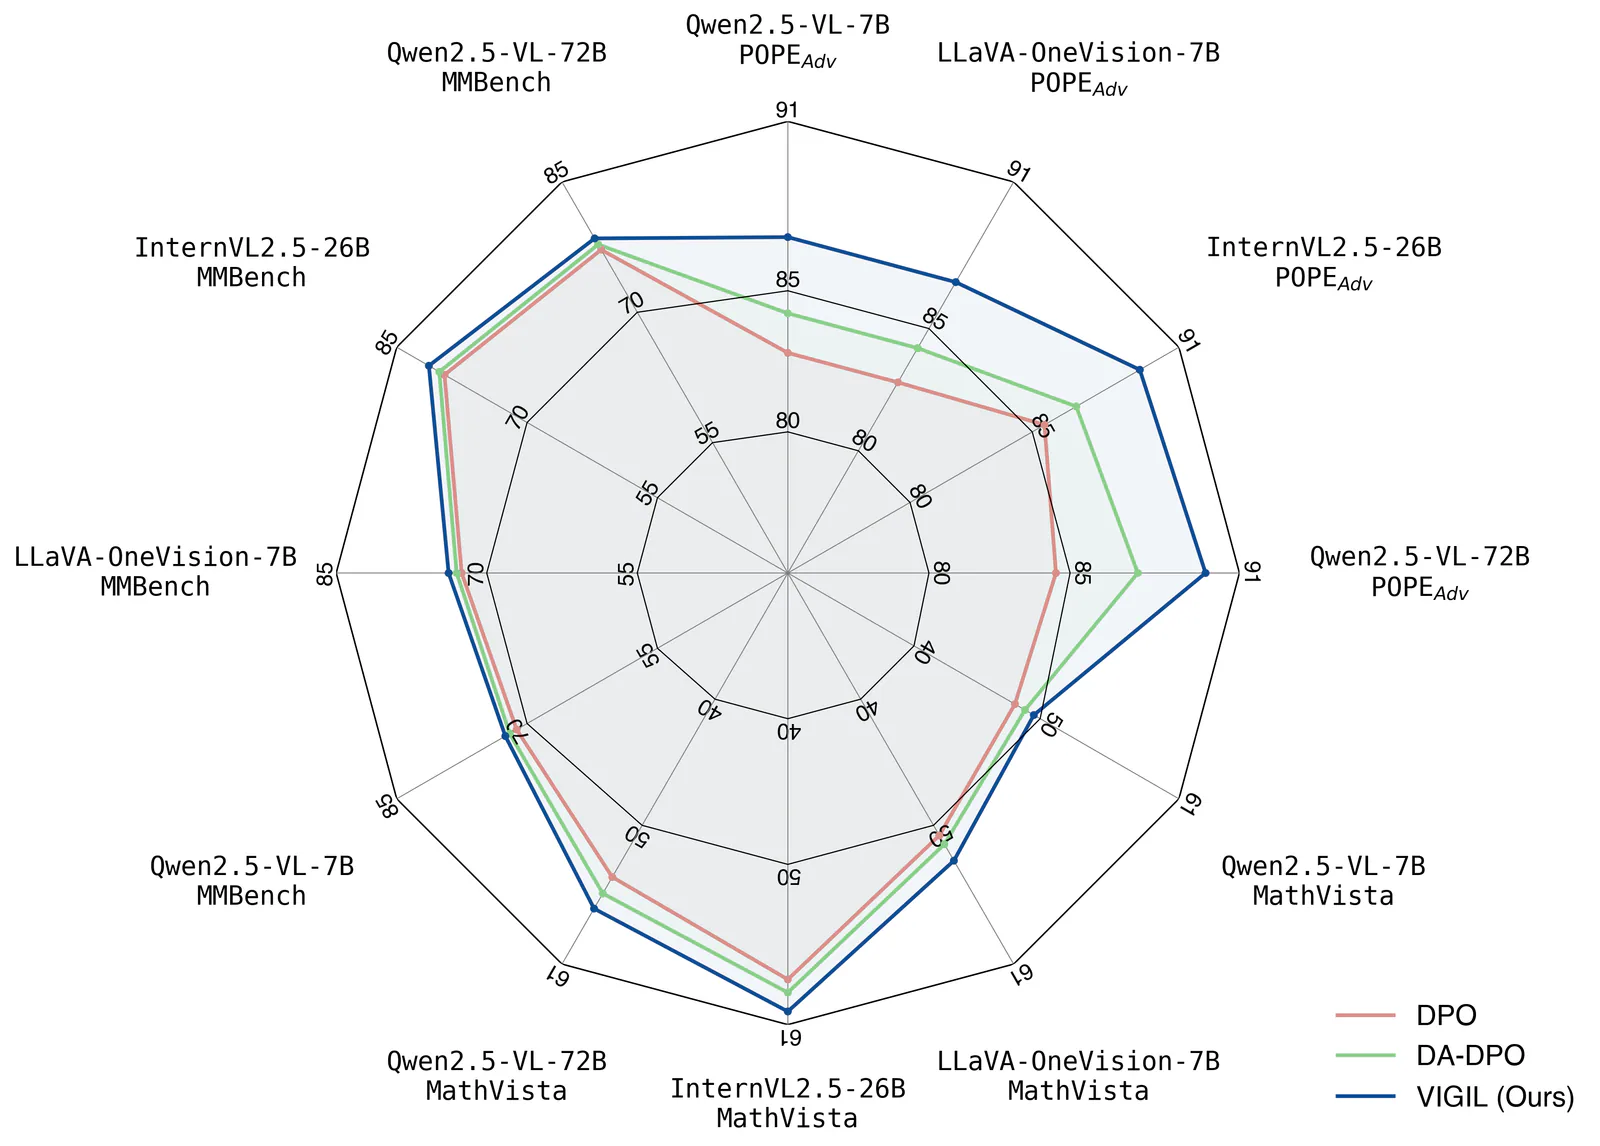
Figures for Papers Create publication-style Matplotlib charts with an AI agent, using scientific plotting conventions, reference scripts and print or vector export guidance.
Repository last pushed Oct 19, 2026
Free
Images
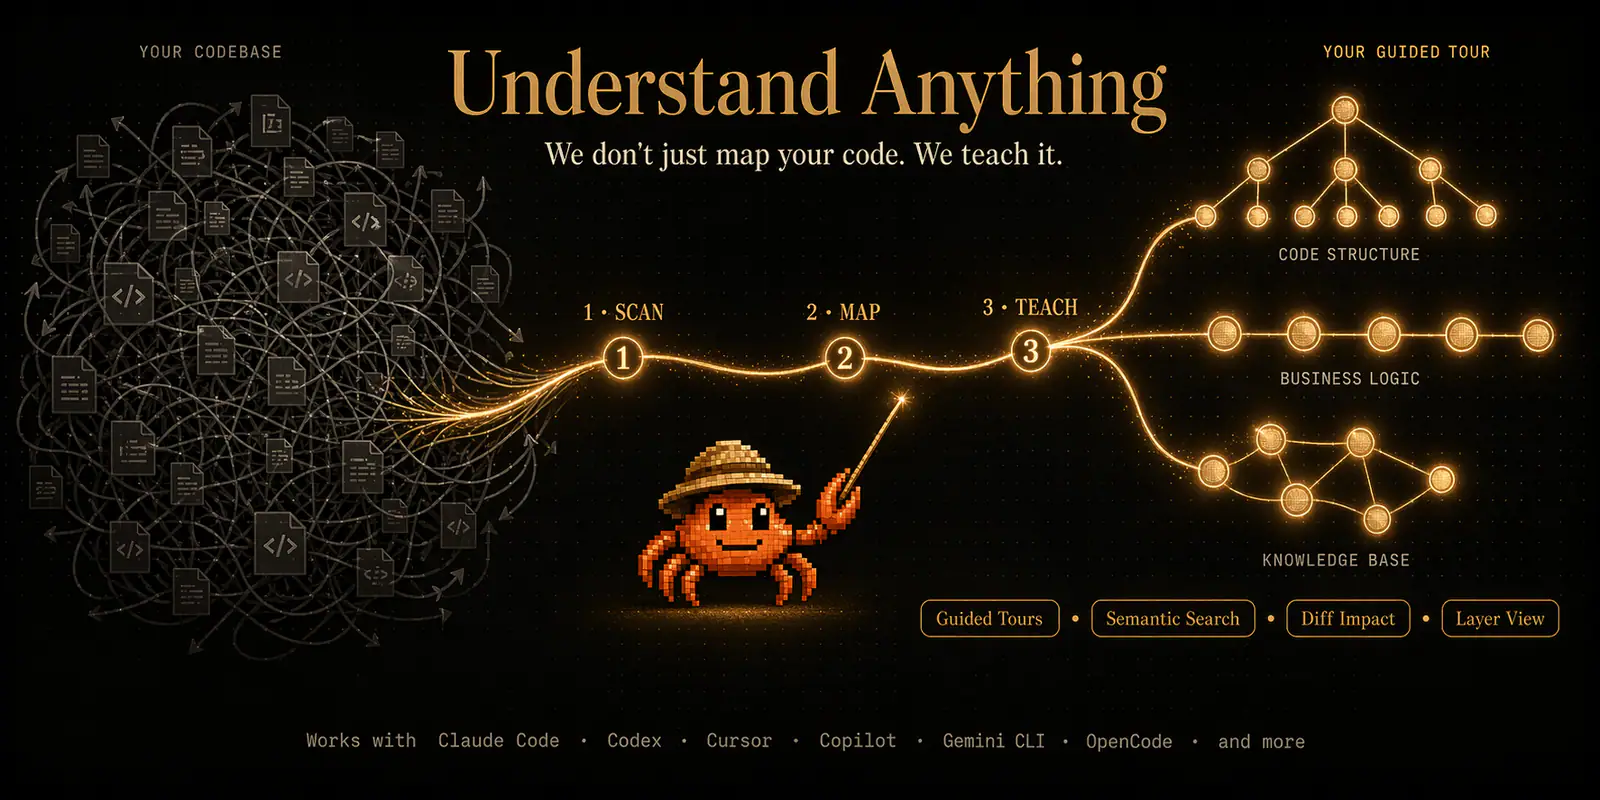
SeeCode Diagrams Create animated and explorable diagrams from compact JSON specifications, with scripted layout, styling, motion, and export workflows.
Repository last pushed Oct 17, 2026
Free
Images
Nature Figure Create scientific figures in Python or R, with multi-panel layout checks, editable outputs and optional AI schematic drafts.
Repository last pushed Oct 15, 2026
Web & UI
AntV L7 Build WebGL map applications with interactive geographic layers, animations, and spatial datasets.
Repository last pushed Sep 8, 2026
Free
Free
Documents
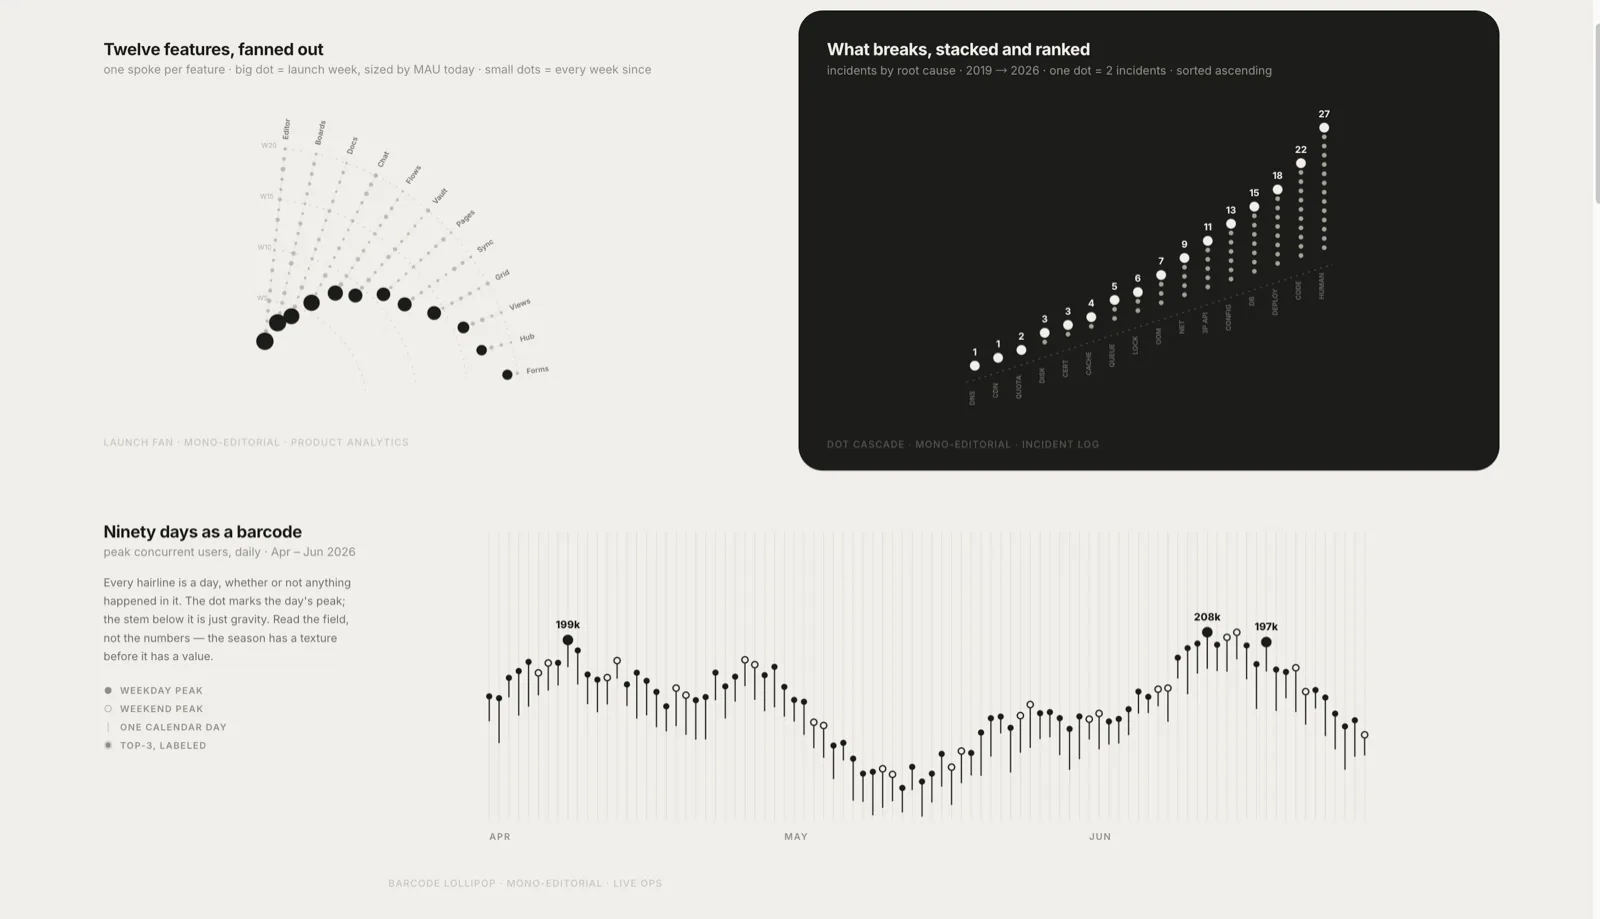
Lieflat Charts Create template-driven HTML data visualizations, full-page reports, and HTML or PDF presentations with consistent typography and chart styles.
Repository last pushed Oct 15, 2026
About Data Analysis AI skills Explore workflows for turning datasets into analysis, charts, and readable findings.
Clean and analyze datasets Create charts and visualizations Summarize findings in reports