Video & Motion
ManimGX
Create mathematical explanations and 3D animations in Python, inspect their layout and timing, and export MP4 videos with editable scene source.
2.7KStars190Forks
Repository last pushed
Academa Labs
These skills help an agent turn structure into a diagram that people can inspect. Members cover Mermaid, Excalidraw, JSON Canvas, architecture graphs, flowcharts, annotation tools, and dashboards.
30 skillsCreate mathematical explanations and 3D animations in Python, inspect their layout and timing, and export MP4 videos with editable scene source.
Turn English or Chinese descriptions into technical SVG diagrams with Codex or Claude Code. Create architecture and workflow diagrams, export PNG or offline interactive HTML, and animate supported scenes as GIFs.
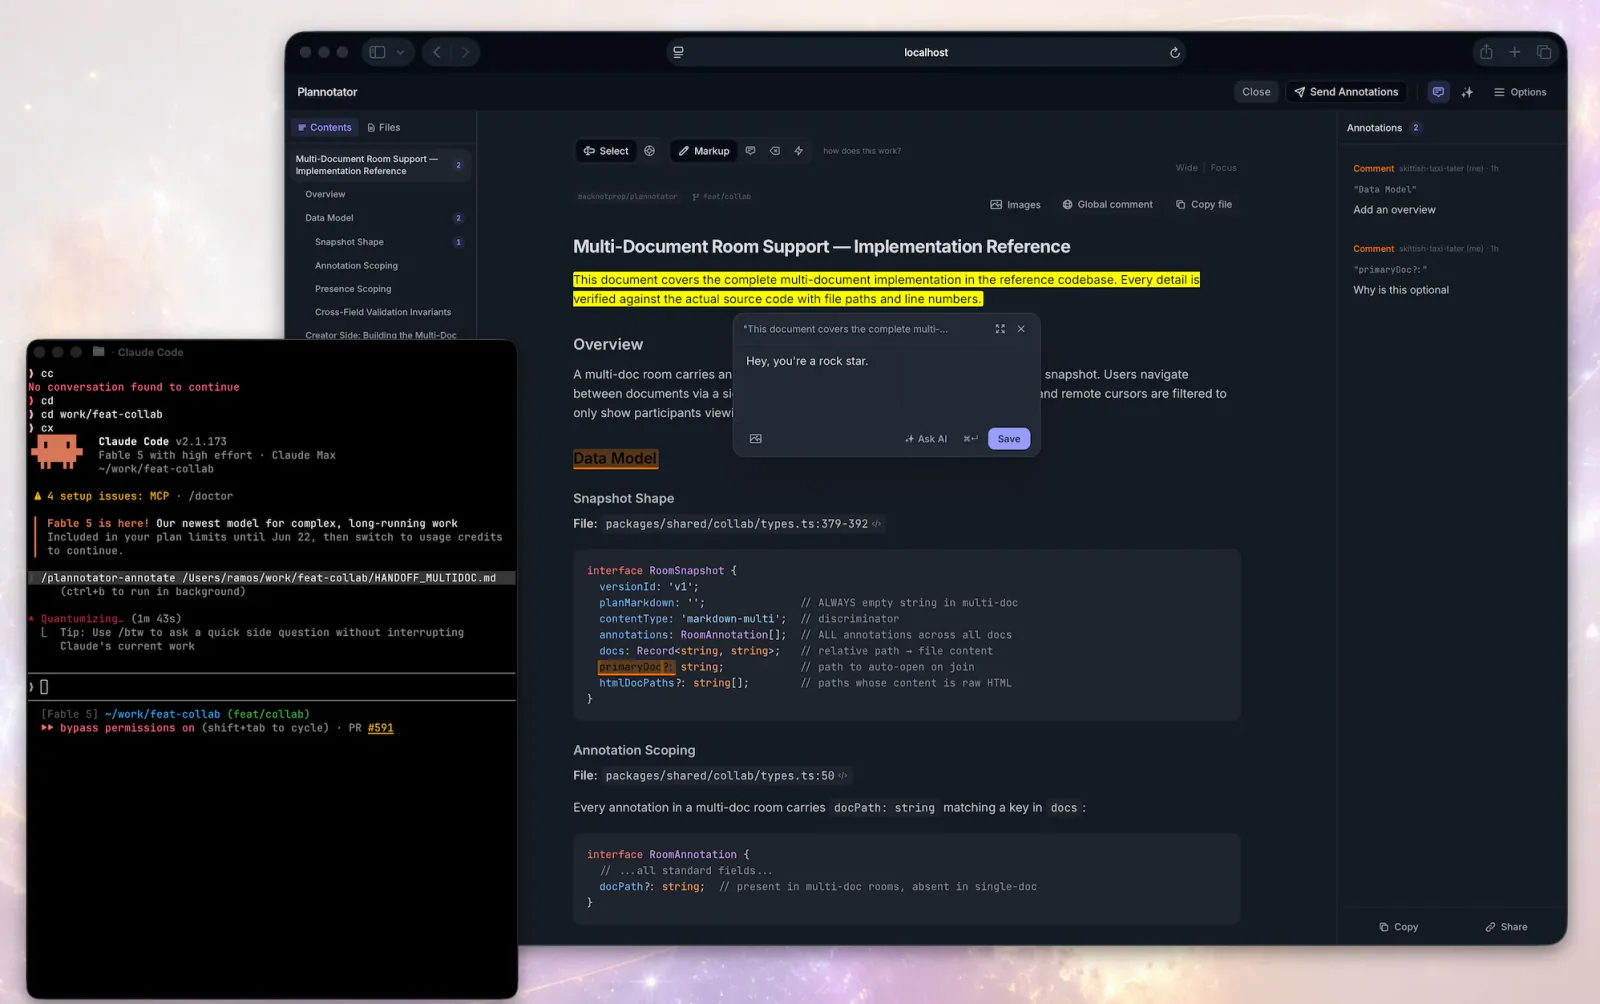
Open Plannotator on the latest rendered assistant message and use the returned annotations to revise that message or continue.
Transform text content into professional Mermaid diagrams for presentations and documentation.
Create animated and explorable diagrams from compact JSON specifications, with scripted layout, styling, motion, and export workflows.
Create Mermaid diagrams and design documents from requirements or source code using focused reference guides.
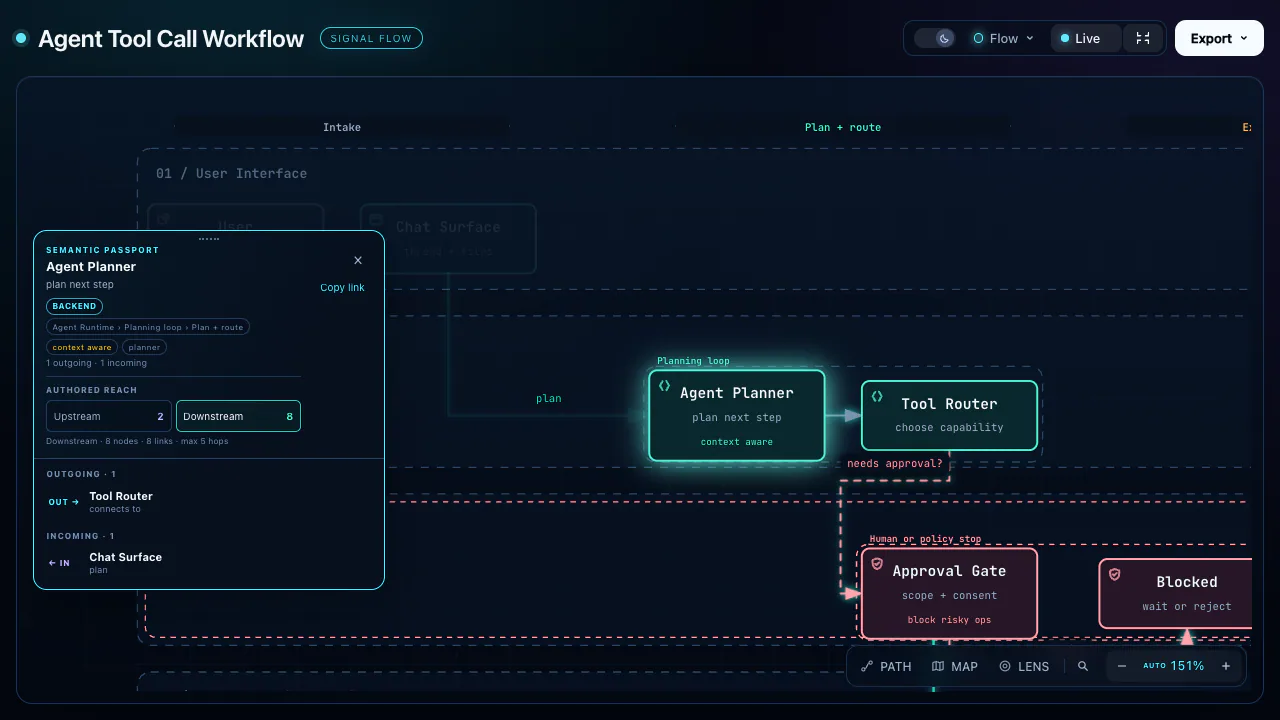
Create explorable HTML diagrams for architectures, workflows, state, schemas, timelines and everyday plans.
Two workflows for visual UI feedback: connect the Agentation toolbar to a React or Next.js project, then add specific design-review annotations in a visible desktop browser.

Create editorial diagrams in your brand with an AI agent. Supports architecture, flowcharts, data charts, and redraws from Mermaid, draw.io, and Excalidraw, with HTML, SVG, and PNG output.
Create patent-style flowcharts and block diagrams with reference numbers.
Turn systems, code changes and plans into visual HTML pages, diagrams and slide decks.
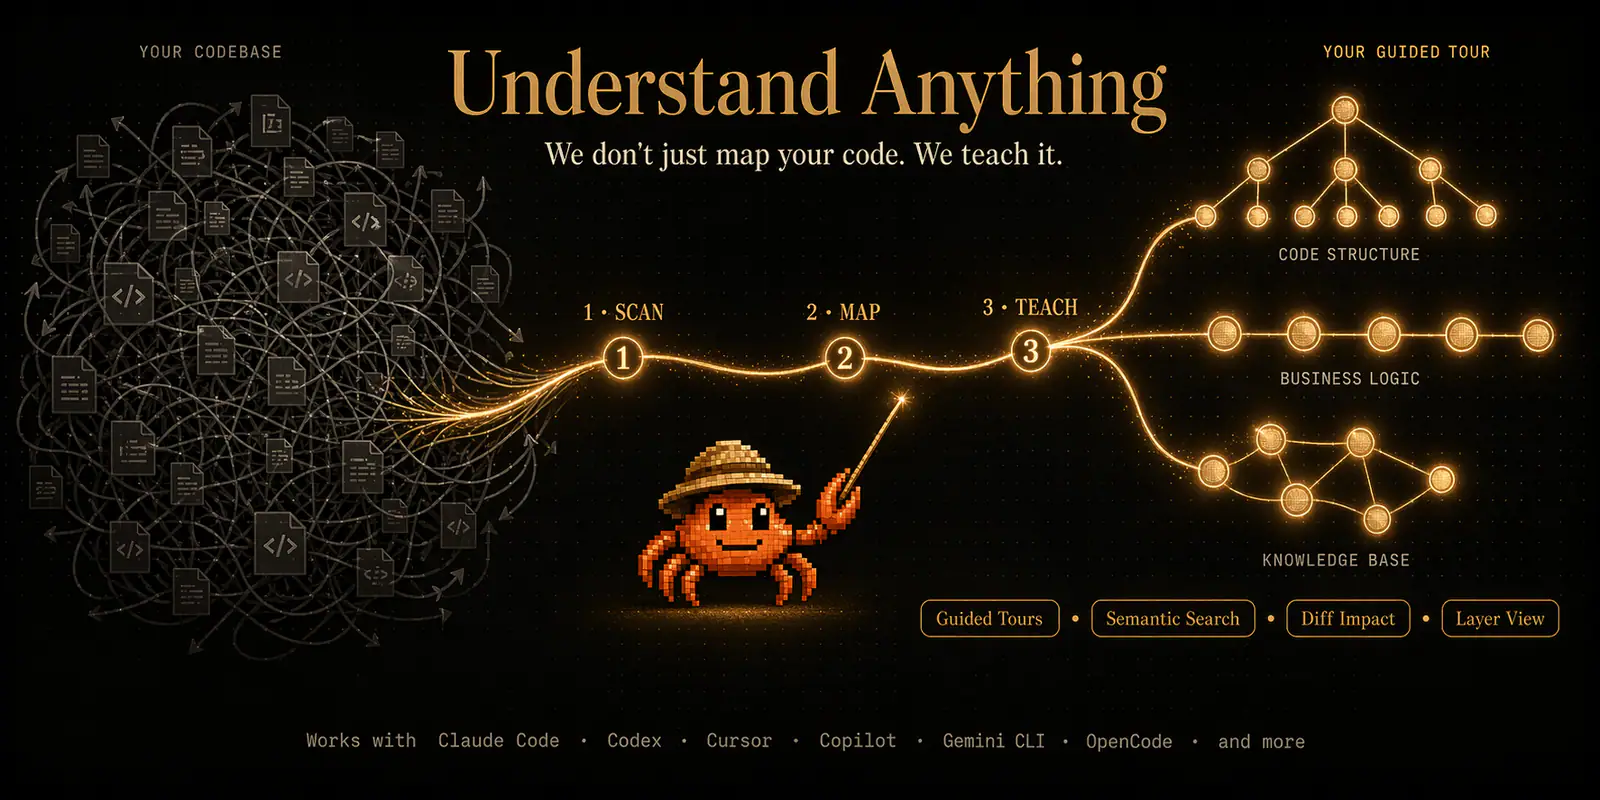
Extract business concepts and workflows into an interactive domain flow graph.
Create an HTML flowchart with process nodes, decisions and connectors.
Create and edit JSON Canvas files (.canvas) with nodes, edges, groups, and connections.
Trace real triggers, call chains, payloads and state changes into compact ASCII flow diagrams.
Create an HTML architecture overview with SVG data flows and deployment context.
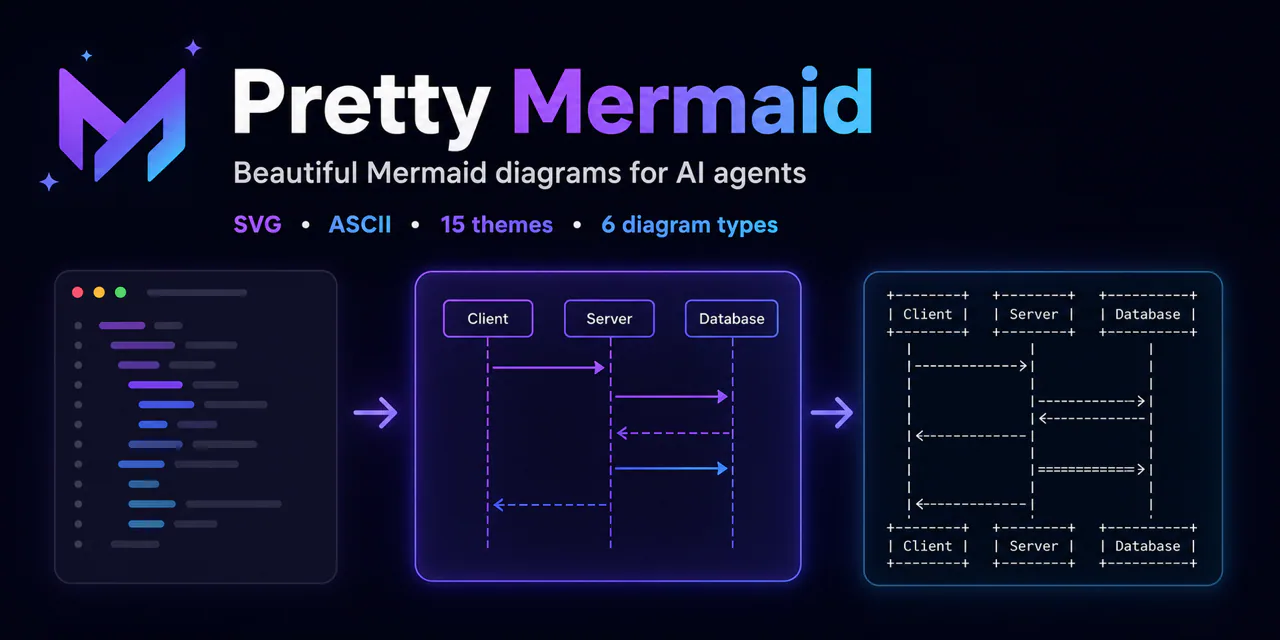
Create and render Mermaid diagrams as themed SVG, PNG, or terminal-friendly text for architecture notes, READMEs, and technical discussions.
Create and refine Mermaid diagrams with a live browser preview and export through an MCP server.
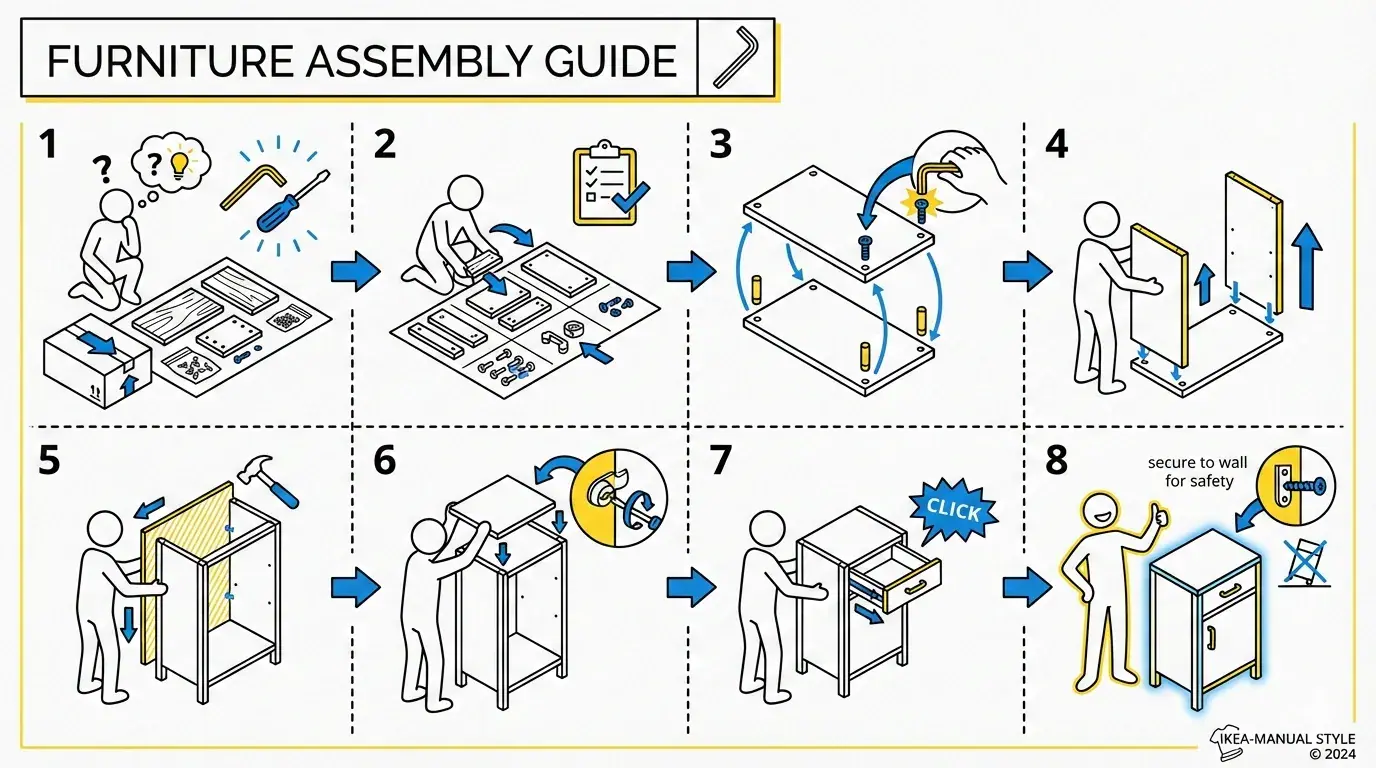
Transform source material into an infographic using selectable layouts and visual styles.
Open Plannotator's annotation UI for a markdown file, plain-text config file (.yaml, .json, .toml, .ini, .csv, .log, …), HTML file, URL, or folder and then respond to the returned annotations.
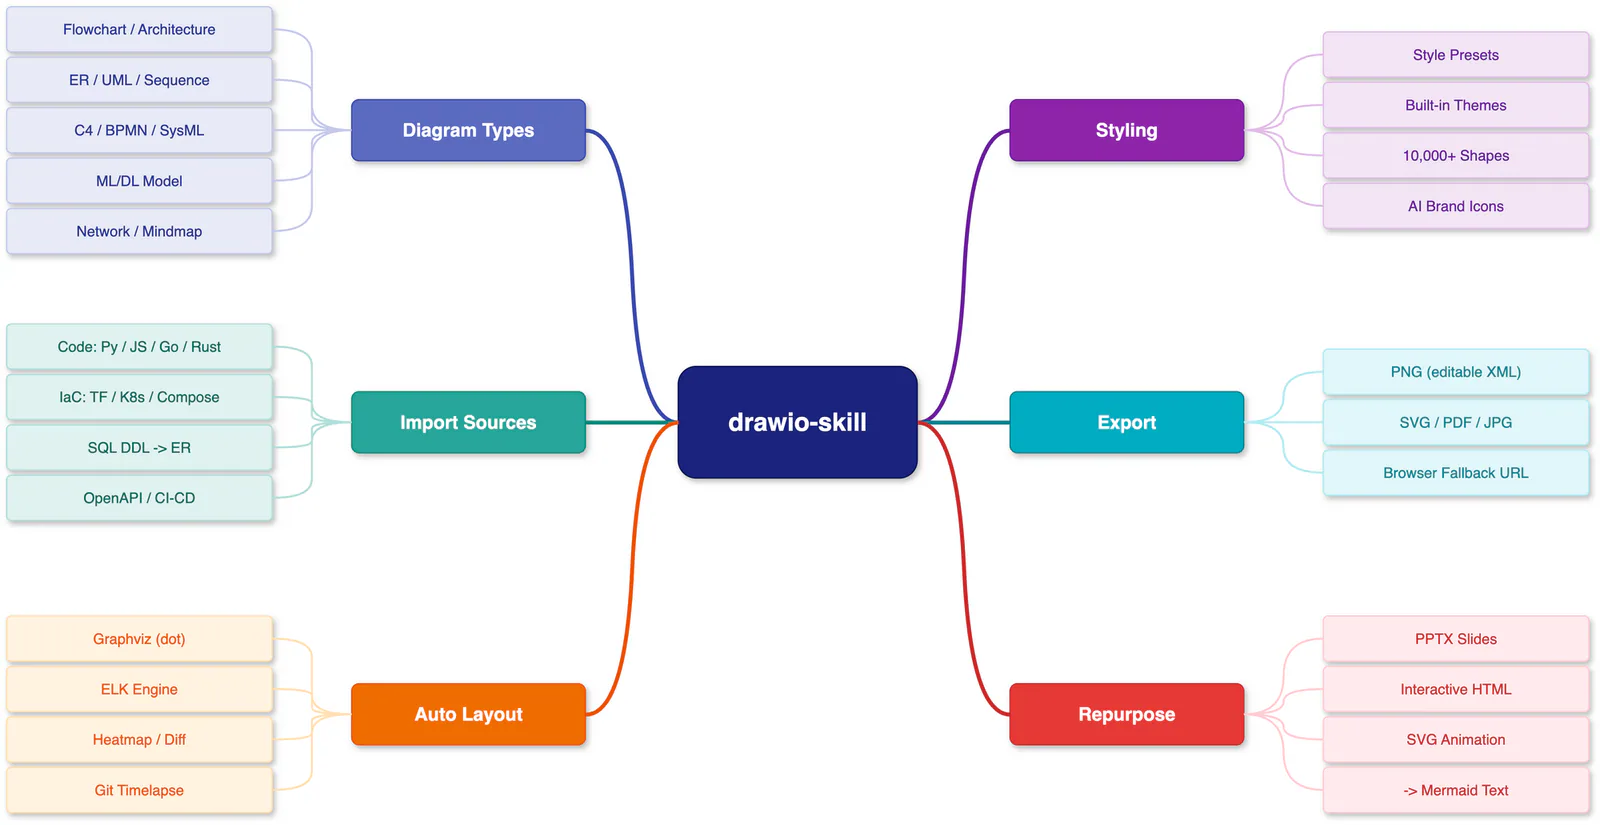
Create editable draw.io diagrams from descriptions, code, infrastructure, and data schemas.
Add the Agentation visual-feedback toolbar to a React or Next.js project, choose manual feedback or MCP sync, and verify the selected connection.
SVG diagramming conventions blending a technical look with CJK-friendly typography. Use when creating flowcharts, architecture diagrams, and similar SVG figures. For one-shot generation, prefer invoking it from a subagent so the main context does not have to carry this skill plus the SVG XML; for multi-round tweaking, use it directly in the main context.
Use Plannotator for plan and code review, artifact annotations, archived decisions and asynchronous feedback.
Generate Excalidraw diagrams from text content. Supports three output modes - Obsidian (.md), Standard (.excalidraw), and Animated (.excalidraw with animation order). Triggers on "Excalidraw", "diagram", "standard excalidraw", "animate".
Explain a technical topic with a concise diagram, code sketch or focused HTML artifact.
Map feature flows, identify repeated concerns, and propose a unified architecture with source-linked handoff prompts.
Generate self-contained HTML visualizations with Plannotator theming.
Review a page in a visible desktop browser and add specific design critiques through Agentation, checking that each annotation was saved.
Create visual HTML articles, interfaces, images, motion videos and narrated web presentations, or retrieve local knowledge.
Use Mermaid for text-defined diagrams, Excalidraw or Canvas for freeform explanation, and architecture or graph entries when relationships are the subject.