Create an HTML dashboard with KPI cards, charts and progress indicators.
694Stars98Forks
Repository last pushed
These skills help an agent turn data into a visual that answers a question. Members cover dashboards, scientific figures, Infographic and diagram tools, AntV maps, HTML artifacts, and slide charts.
18 skillsCreate an HTML dashboard with KPI cards, charts and progress indicators.
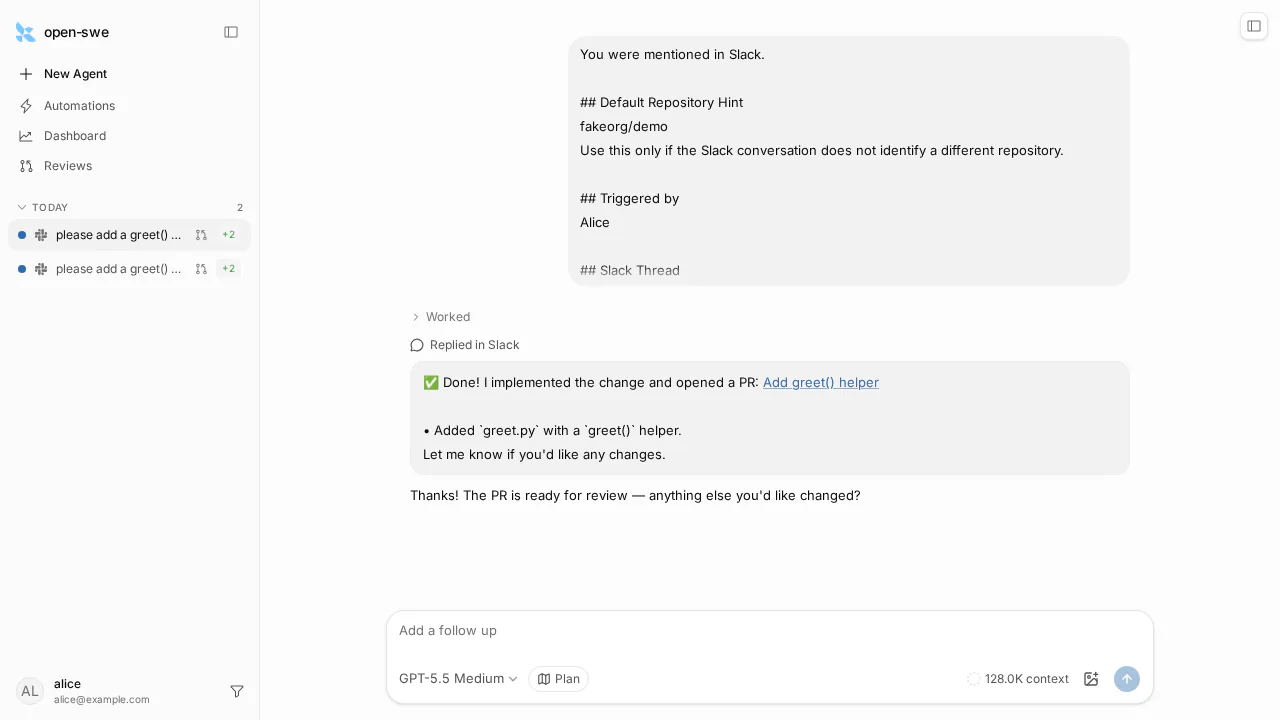
Build themed HTML plan artifacts, dashboard iframes and Slack attachments for the Open SWE runtime.
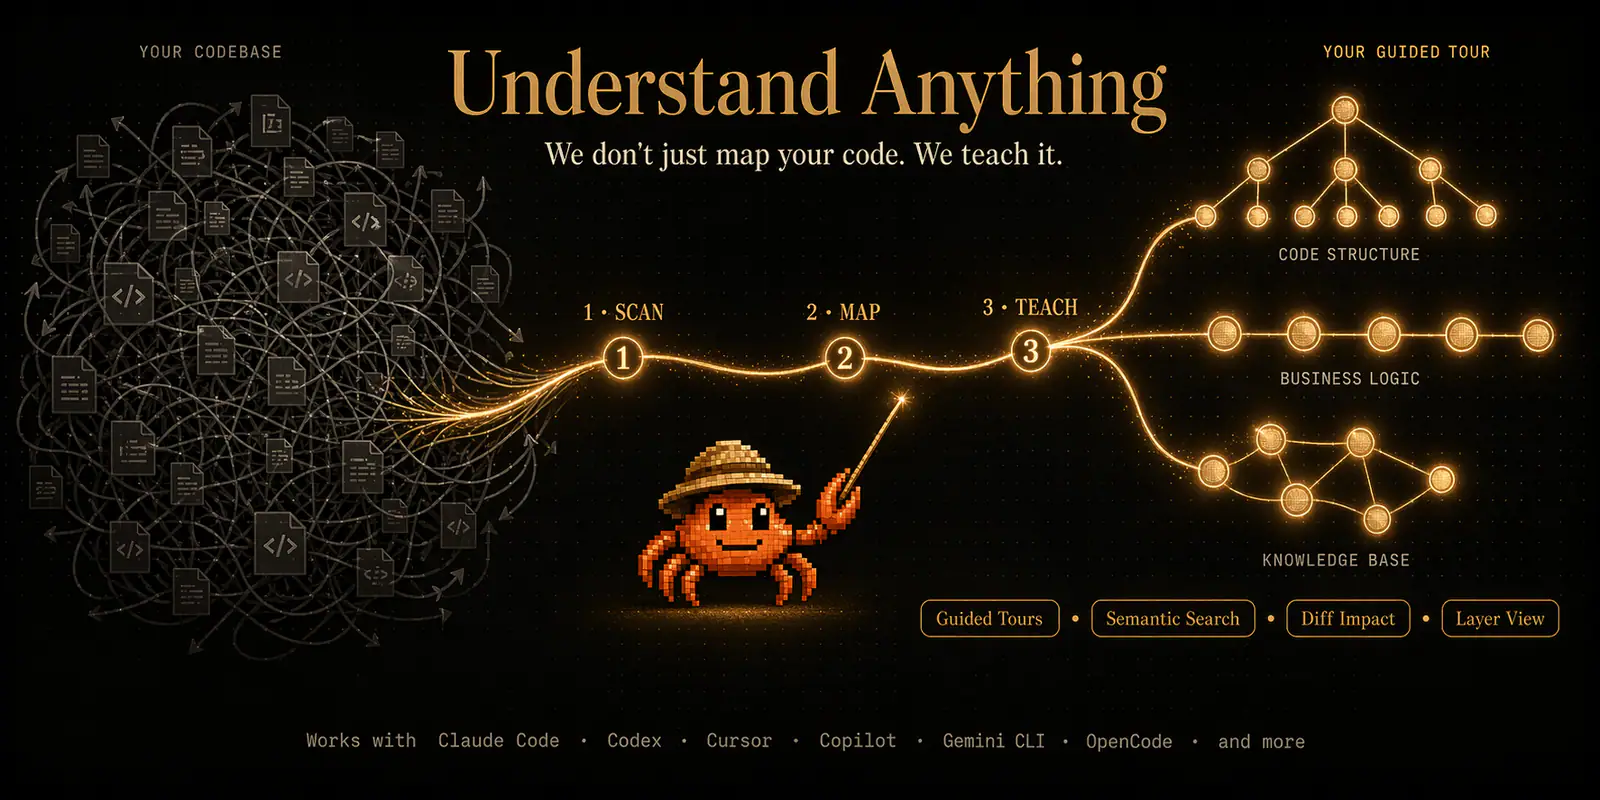
Launch an interactive dashboard for exploring a project’s saved knowledge graph.
Choose a dashboard entry for interactive monitoring, a scientific figure skill for papers, and diagram or slide tools when the visual must explain rather than explore data.