Video & Motion
ManimGX
Create mathematical explanations and 3D animations in Python, inspect their layout and timing, and export MP4 videos with editable scene source.
2.7KStars190Forks
Repository last pushed
Academa Labs
These skills help an agent turn data into a visual that answers a question. Members cover dashboards, scientific figures, Infographic and diagram tools, AntV maps, HTML artifacts, and slide charts.
18 skillsCreate mathematical explanations and 3D animations in Python, inspect their layout and timing, and export MP4 videos with editable scene source.
Turn systems, code changes and plans into visual HTML pages, diagrams and slide decks.
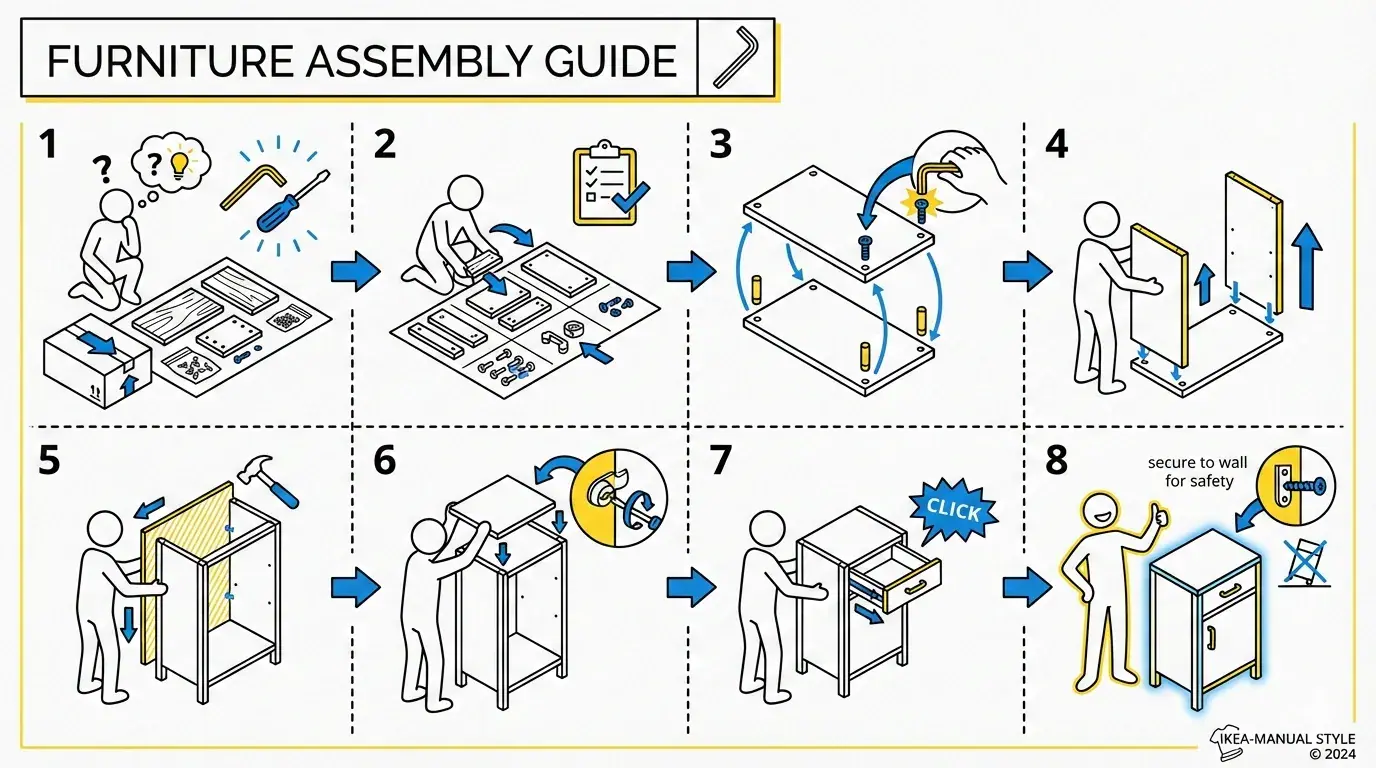
Transform source material into an infographic using selectable layouts and visual styles.
Create visual HTML articles, interfaces, images, motion videos and narrated web presentations, or retrieve local knowledge.
Choose a dashboard entry for interactive monitoring, a scientific figure skill for papers, and diagram or slide tools when the visual must explain rather than explore data.