Figures for Papers
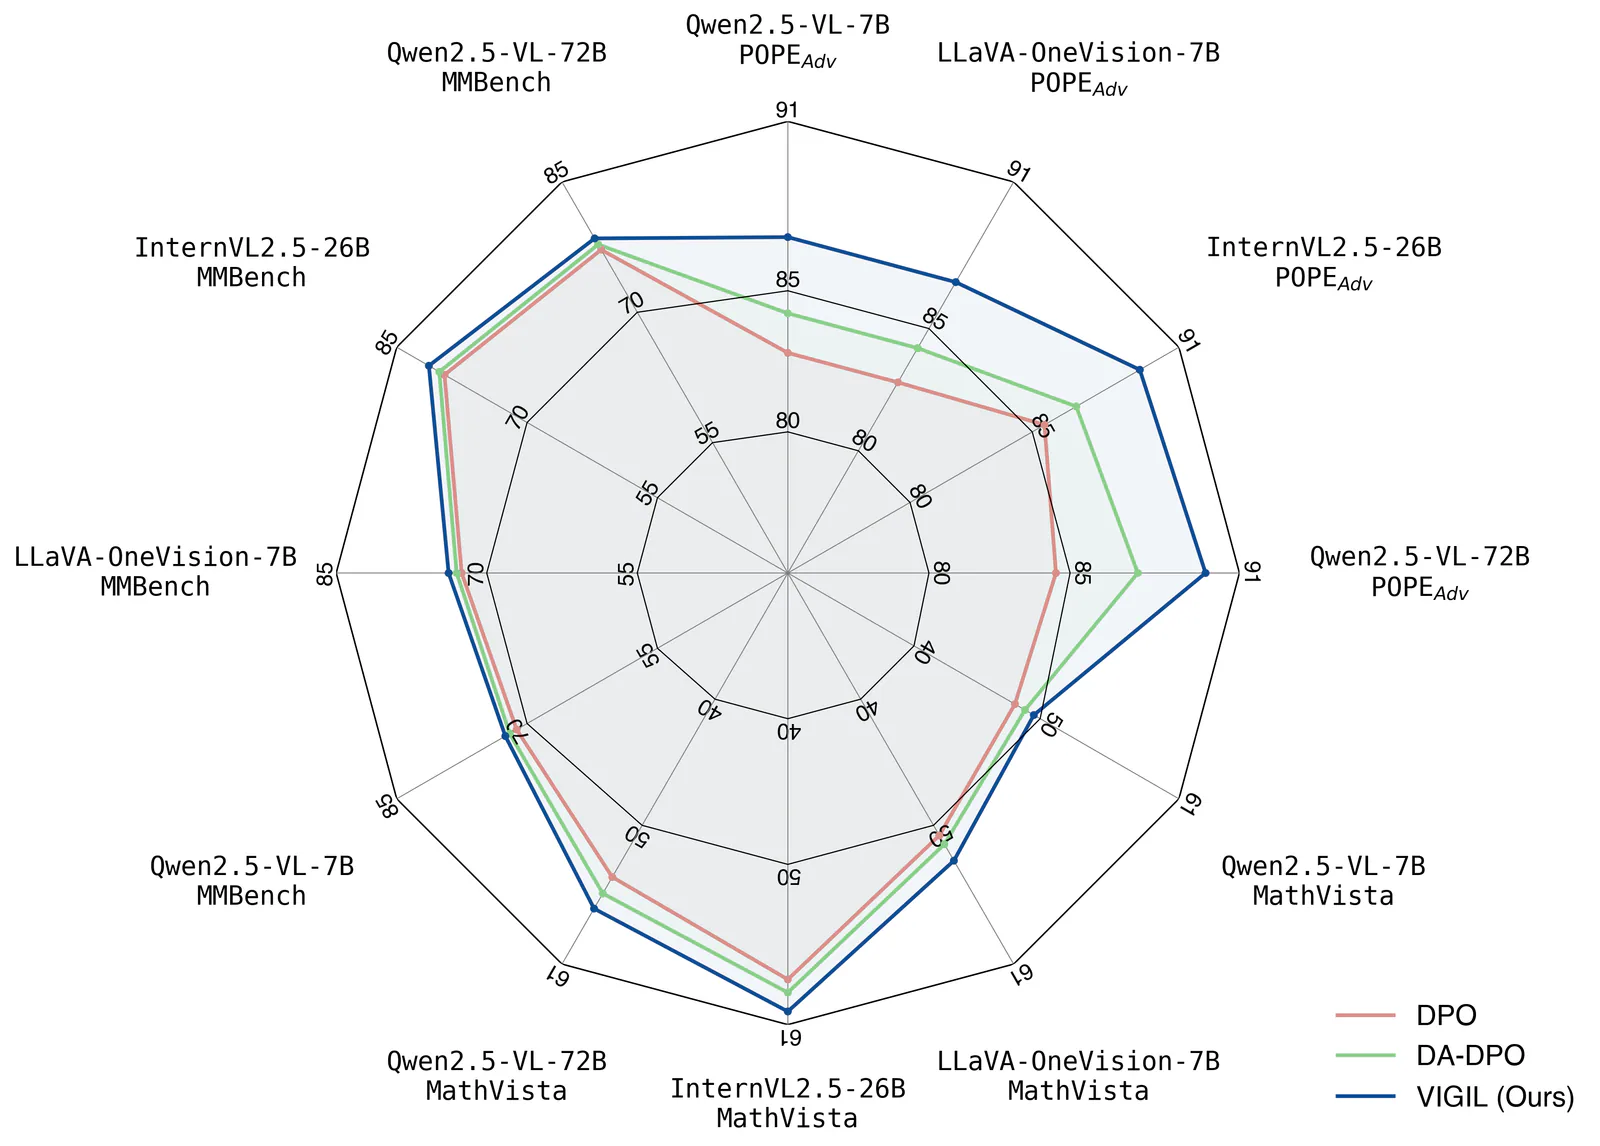
Create publication-style Matplotlib charts with an AI agent, using scientific plotting conventions, reference scripts and print or vector export guidance.
These skills help an agent produce illustrations, icons and figures rather than photos. The range is wide, from pixel art and character design to technical graphs, article covers and figures for papers.
30 skillsCreate publication-style Matplotlib charts with an AI agent, using scientific plotting conventions, reference scripts and print or vector export guidance.
Turn technical concepts into interactive isometric machines: detailed SVG illustrations, WebGL effects and optional 3D motion, as HTML, SVG or React components.
Plan illustrations at useful points in an article, keep the visual style consistent and insert supplied images into Markdown.
Turn a visual philosophy into original poster art and carefully composed PNG or PDF designs.
Plan a Character Bible through positioning, character, visual, system and commercial design cards.
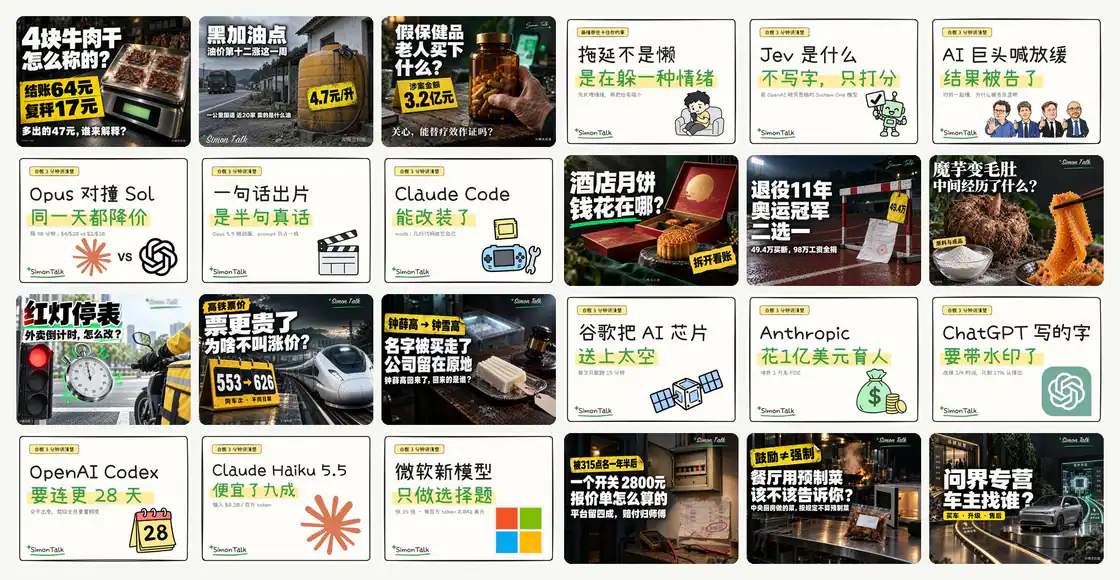
Extract a central message and audience from article text or subtitles, then design a cover image prompt.
Create original seeded generative art with p5.js and an interactive parameter viewer.
Create scientific figures in Python or R, with multi-panel layout checks, editable outputs and optional AI schematic drafts.
Create hand-drawn explainer videos with animated strokes, generated stickers, narration, synchronized subtitles, configurable branding and landscape or portrait covers.
Turn a poster brief into structured prompts with audience, message, density, emotion, color and illustration style.
Build prompts with distinct character and scene visual languages, combining two drawn styles or drawing with realism.
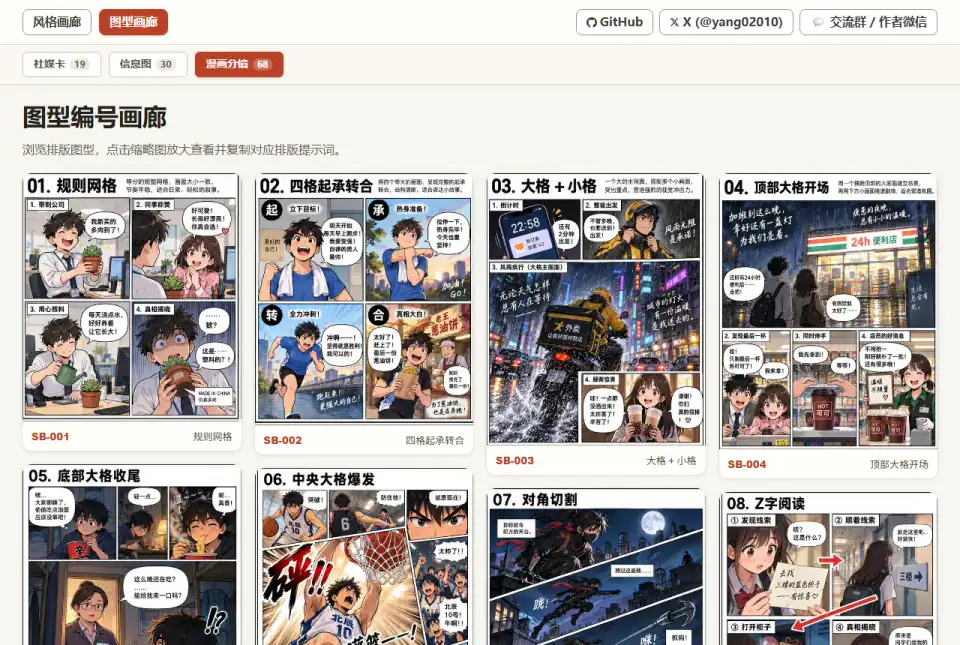
Combine a subject with numbered hand-drawn styles, layouts and colors to create copyable image prompts.
Match the skill to the style: pixel art skills for game-like graphics, SVG and diagram skills for technical visuals, and cover or illustration planners for blog and social posts.