Icon & Illustration Skills for Claude Code, Codex & AI Agents
These skills help an agent produce illustrations, icons and figures rather than photos. The range is wide, from pixel art and character design to technical graphs, article covers and figures for papers.
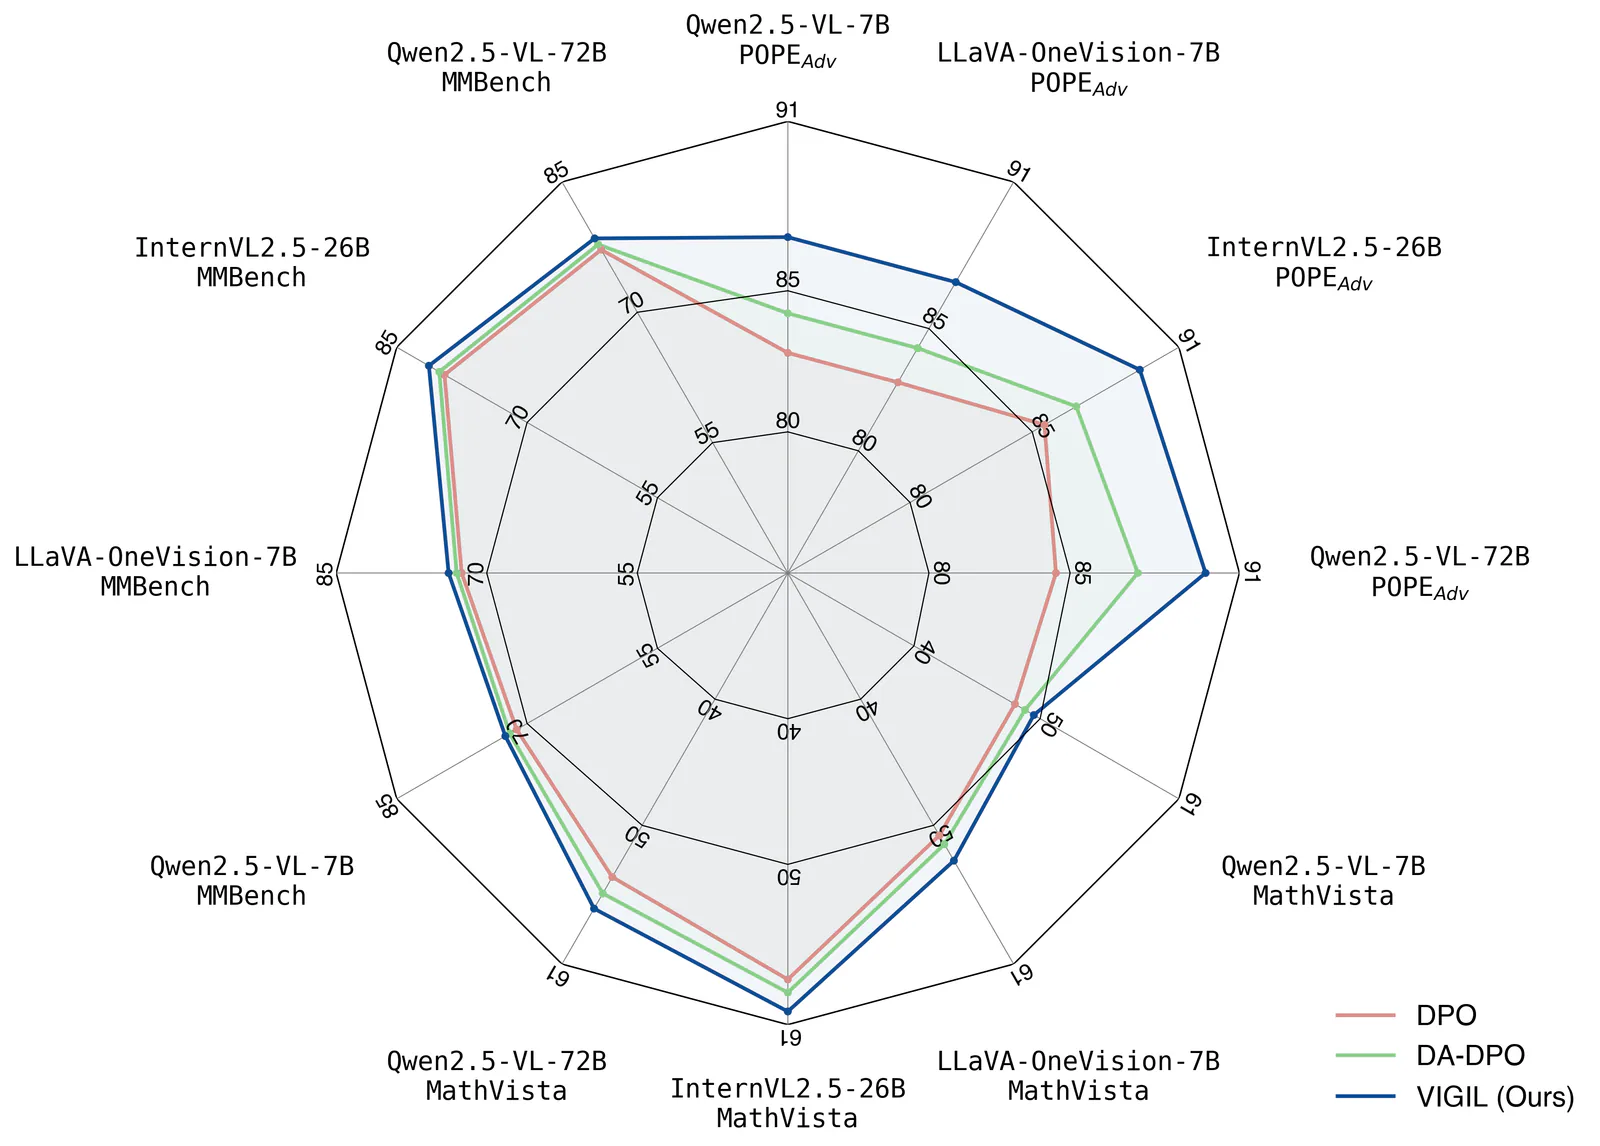
Create publication-style Matplotlib charts with an AI agent, using scientific plotting conventions, reference scripts and print or vector export guidance.
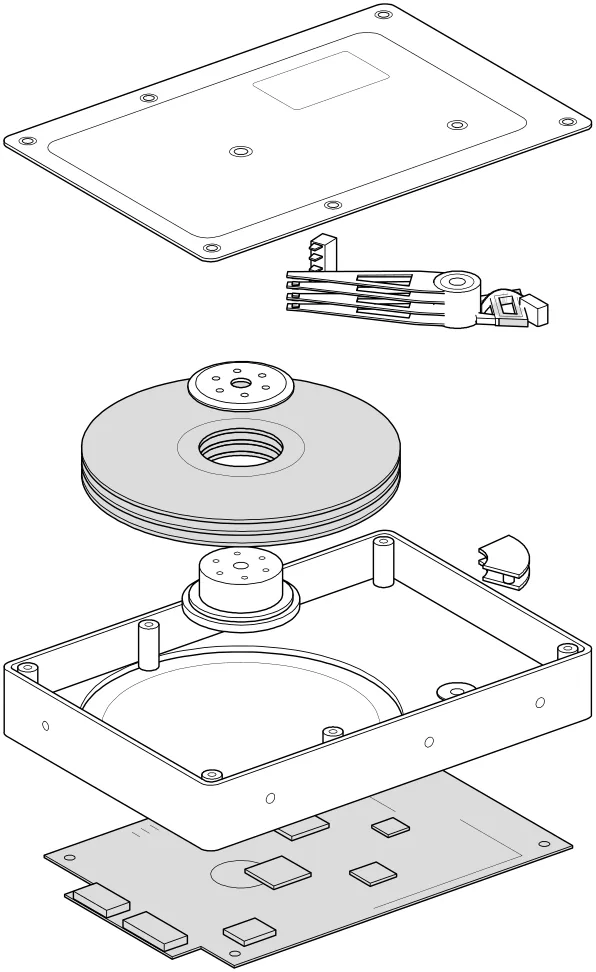
Turn technical concepts into interactive isometric machines: detailed SVG illustrations, WebGL effects and optional 3D motion, as HTML, SVG or React components.
Turn English or Chinese descriptions into technical SVG diagrams with Codex or Claude Code. Create architecture and workflow diagrams, export PNG or offline interactive HTML, and animate supported scenes as GIFs.
Build animated ink-on-paper illustrations in SVG and TypeScript, from walking figures to interactive day-night scenes and deterministic video captures.
Animate a finished dimensional drawing into an 8–15 second film with progressive strokes, camera moves, and lifted layers, using Claude Motion or a headless renderer.
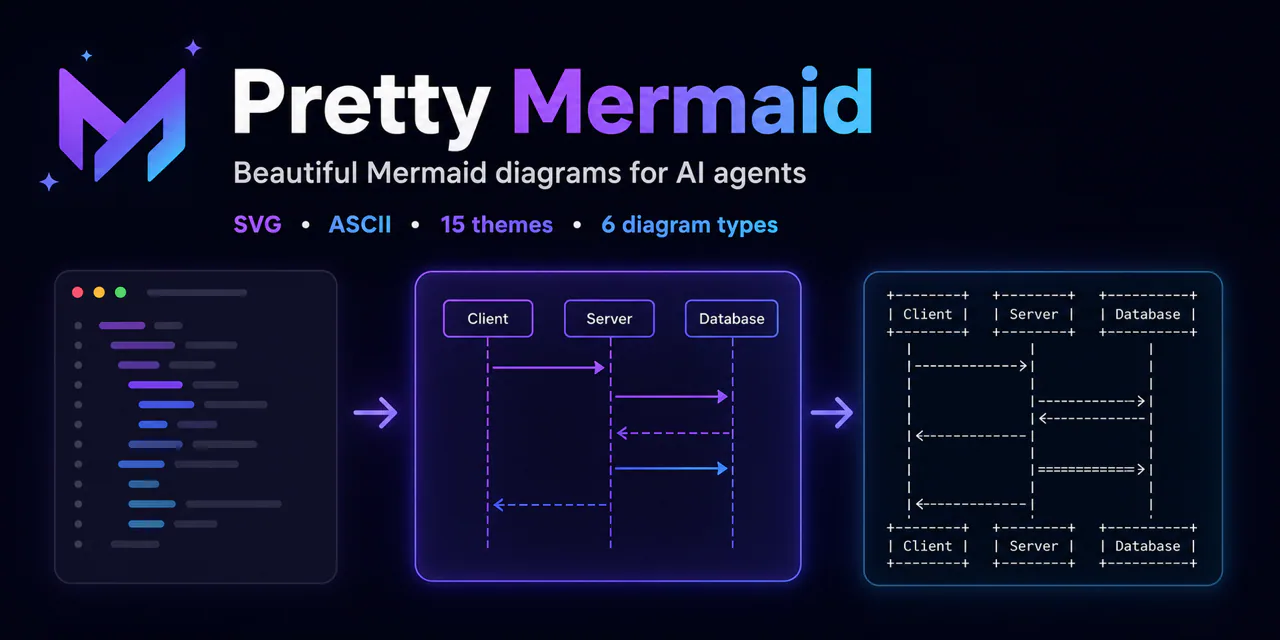
Create editorial diagrams in your brand with an AI agent. Supports architecture, flowcharts, data charts, and redraws from Mermaid, draw.io, and Excalidraw, with HTML, SVG, and PNG output.
Generate cohesive, project-specific SVG icon sets for websites and applications. Use this skill whenever the user needs custom icons, an icon set for a website or app, icons for a client project, or mentions needing SVG icons that look consistent together. Also trigger when the user describes a project and icons would naturally be part of the deliverable — e.g. 'I'm building a site for a plumber' implies they'll need service icons. Trigger on: 'icons for', 'icon set', 'custom icons', 'SVG icons', 'make me icons', 'I need icons', 'website icons', 'project icons', or any request for consistent visual assets for a web project. Produces individual SVG files with a consistent style engine, not generic icon library lookups.
SVG diagramming conventions blending a technical look with CJK-friendly typography. Use when creating flowcharts, architecture diagrams, and similar SVG figures. For one-shot generation, prefer invoking it from a subagent so the main context does not have to carry this skill plus the SVG XML; for multi-round tweaking, use it directly in the main context.
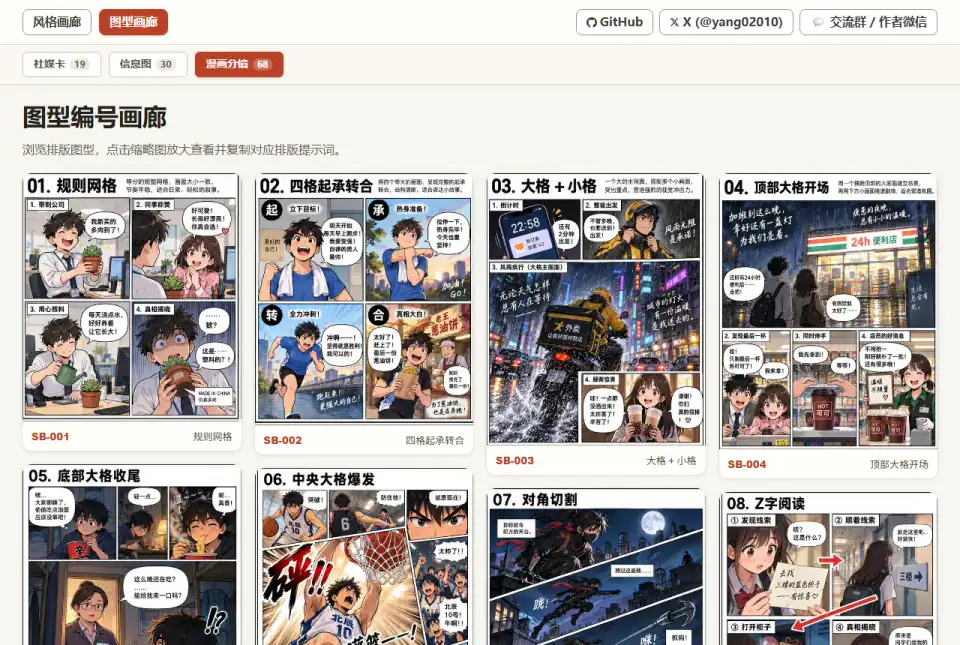
Match the skill to the style: pixel art skills for game-like graphics, SVG and diagram skills for technical visuals, and cover or illustration planners for blog and social posts.